Overview
After a process crashes, the system detects the crash, captures crash information, generates crash logs, and reports crash events, providing detailed maintenance and debugging logs for you to locate faults. This topic describes the CppCrash detection methods provided by the system in terms of basic concepts, implementation principles, restrictions, log obtaining, and log specifications.
Basic Concepts
-
Signal
A mechanism for inter-process communication in POSIX-compliant operating systems.
-
Signal handler
A function that defines a series of processing operations executed by a process after receiving a signal. The signal handler must specify the signals it needs to handle.
-
pc
Program Counter (PC) stores the address of the instruction that is being executed by the program.
-
lr
Link Register stores the return address of the subprogram.
-
sp
Stack Pointer stores the address of the top of the stack for the current function.
-
fp
Frame Pointer stores the address of the bottom of the stack for the current function.
-
Call stack
Records the sequence of function calls for each thread, from its start up to the current point (such as the crash site).
-
Register
High-speed storage unit in the CPU, which are used to store data, instruction addresses, or status information required during the execution of computer programs. In this topic, register information refers to the data, instruction addresses, or status information stored in the register when a crash occurs.
Implementation Principles
The system detects a process crash as follows:
-
After a process crashes, it receives a crash signal from the kernel, which is processed by the signal handling module registered by the process during startup.
-
After receiving the crash signal, the process saves the current process context and forks a child process to execute the ProcessDump command to capture crash information.
-
The ProcessDump process writes the crash log data to a temporary directory for storage.
-
After collecting crash logs, the ProcessDump process reports the logs to the HiView process, supplements some information (such as the system memory status and app page switching history) that can be obtained only by HiView, stores the crash logs in the /data/log/faultlog/faultlogger directory, and generates a fault event.
[h2]Crash Signals
Based on the POSIX signal mechanism, the system's process crash detection capability supports the following crash signals.
| Signo | Signal | Description | Trigger Cause |
|---|---|---|---|
| 4 | SIGILL | Invalid instruction | An invalid, incorrectly formatted, unknown, or privileged instruction is executed. |
| 5 | SIGTRAP | Breakpoint or trap | An exception occurs or a trap instruction is executed. |
| 6 | SIGABRT | Process abort | The process is aborted abnormally. Generally, this exception occurs when the process calls abort() in the Standard Function Library. |
| 7 | SIGBUS | Illegal memory access | The process accesses an unaligned or nonexistent physical address. |
| 8 | SIGFPE | Floating-point exception | An incorrect arithmetic operation is executed, for example, a 0 divisor, floating point overflow, or integer overflow. |
| 11 | SIGSEGV | Invalid memory access | The process accesses an invalid memory region. |
| 16 | SIGSTKFLT | Stack error | The processor executes an incorrect stack operation, such as popping from an empty stack or pushing onto a full stack. The SIGSTKFLT signal does not support minidump generation. |
| 31 | SIGSYS | Incorrect system call | An incorrect or invalid parameter is used in a system call. |
Crash signals are classified by error code (code) as follows:
[h2]SIGILL
SIGILL indicates an invalid instruction exception in Unix and Unix-like operating systems. The trigger causes of SIGILL are as follows.
| Error Code (code) | Value | Description | Trigger Cause |
|---|---|---|---|
| 1 | ILL_ILLOPC | Illegal operation code | An instruction not supported by the CPU or an invalid instruction is executed. |
| 2 | ILL_ILLOPN | Illegal operand | An incorrect operand or improper operand type is used. |
| 3 | ILL_ILLADR | Illegal address | The program accesses an invalid memory address or an unaligned memory address. |
| 4 | ILL_ILLTRP | Illegal trap | The program performs an illegal trap instruction or an undefined operation. |
| 5 | ILL_PRVOPC | Illegal privileged operation code | A common user executes a privileged instruction. |
| 6 | ILL_PRVREG | Illegal privileged register | A common user accesses a privileged register. |
| 7 | ILL_COPROC | Illegal coprocessor | The program performs an undefined coprocessor instruction. |
| 8 | ILL_BADSTK | Illegal stack | The program performs an operation at an invalid stack address, or when the stack overflows. |
| 0xacac | ILL_ILLPACCFI | Illegal pointer authentication | The program fails to verify a pointer. |
[h2]SIGTRAP
SIGTRAP usually occurs in debugging and tracking. The trigger causes of SIGTRAP are as follows.
| Error Code (code) | Value | Description | Trigger Cause |
|---|---|---|---|
| 1 | TRAP_BRKPT | Software breakpoint | The program reaches the software breakpoint. When debugging a program, a software breakpoint at the key position can be used to pause the program execution and check information such as variable values. |
| 2 | TRAP_TRACE | Single-step debugging | The program executes a single instruction. Single instruction can be used to check the execution result of each instruction. |
| 3 | TRAP_BRANCH | Branch tracing | The program executes a branch instruction. Branch instruction can be used to control the execution process of a program, such as if statements and loop statements. |
| 4 | TRAP_HWBKPT | Hardware breakpoint | The program reaches the hardware breakpoint. When debugging a program, a hardware breakpoint at the key position can be used to pause the program execution and check information such as variable values. Unlike a software breakpoint, a hardware breakpoint is implemented in CPU hardware. Therefore, whether a hardware breakpoint is triggered can be detected in real time during program execution. |
[h2]SIGBUS
The SIGBUS signal is sent by the operating system to a process. It usually indicates a memory access error. The trigger causes of SIGBUS are as follows.
| Error Code (code) | Value | Description | Trigger Cause |
|---|---|---|---|
| 1 | BUS_ADRALN | Unaligned memory address | The program accesses an unaligned memory address, for example, a non-even address of a 4-byte integer. |
| 2 | BUS_ADRERR | Invalid memory address | The program accesses a memory address that does not exist in the process address space, such as a null pointer. |
| 3 | BUS_OBJERR | Invalid object access | The program accesses a deleted or uninitialized object. |
| 4 | BUS_MCEERR_AR | Hardware memory error requiring immediate handling | The program accesses memory and encountered a hardware memory error requiring immediate handling. |
| 5 | BUS_MCEERR_AO | Hardware memory error requiring waiting or delayed handling | The program accesses memory and encountered a hardware memory error requiring waiting or delayed handling. |
[h2]SIGFPE
The SIGFPE signal indicates a floating-point exception or an arithmetic exception. The trigger causes of SIGFPE are as follows.
| Error Code (code) | Value | Description | Trigger Cause |
|---|---|---|---|
| 1 | FPE_INTDIV | Invalid integer division | The program performs an integer division operation while the divisor is zero. |
| 2 | FPE_INTOVF | Integer overflow | The program performs an integer operation and the result exceeds the integer range. |
| 3 | FPE_FLTDIV | Invalid floating-point division | The program performs a floating-point division operation while the divisor is zero. |
| 4 | FPE_FLTOVF | Floating-point overflow | The program performs a floating-point operation and the result exceeds the upper limit of the floating-point number. |
| 5 | FPE_FLTUND | Floating-point underflow | The program performs a floating-point operation and the result is less than the lower limit of the floating-point number. |
| 6 | FPE_FLTRES | Invalid floating-point result | The program performs a floating-point operation and the result is undefined. |
| 7 | FPE_FLTINV | Invalid floating-point operation | The program performs an invalid floating-point operation. |
| 8 | FPE_FLTSUB | Invalid floating-point operation result | The program attempts to perform a floating-point operation and the floating-point result is out of range. |
[h2]SIGSEGV
SIGSEGV occurs when a process accesses a non-existent memory address or an inaccessible address. The trigger causes of the SIGSEGV signal are described as follows:
| Error Code (code) | Value | Description | Trigger Cause |
|---|---|---|---|
| 1 | SEGV_MAPERR | Non-existent memory address | The process accesses a memory address that does not exist or that is not mapped to the process address space. This exception is usually caused by pointer errors or memory leaks. |
| 2 | SEGV_ACCERR | Inaccessible memory address | The process accesses an inaccessible memory address marked by the operating system, for example, writing data to read-only memory or executing memory without execution permission. This exception is usually caused by buffer overflow or modifying read-only memory. |
[h2]Signal Causes
In addition to the preceding classification by signo, signals can also be classified by causes. The code values classified by causes are as follows.
| Error Code (code) | Value | Description | Trigger Cause |
|---|---|---|---|
| 0 | SI_USER | User space signal | Sent from a process in user space to another process, usually using kill(). For example, when a user presses Ctrl+C on the terminal, a SIGINT signal is sent to all foreground processes. |
| 0x80 | SI_KERNEL | Kernel signal | Sent from the kernel to a process when the kernel detects an error or exception. For example, when a process accesses an invalid memory address or executes an invalid instruction, the kernel sends a SIGSEGV signal to the process. |
| -1 | SI_QUEUE | sigqueue() signal | Sent from sigqueue(), with an additional integer value and a pointer can be carried. It is usually used for advanced communication between processes, such as transferring data or notifying a process that an event occurs. |
| -2 | SI_TIMER | Timer signal | Sent from a timer for executing scheduled tasks or periodic tasks. For example, when a timer expires, the kernel sends a SIGALRM signal to the process. |
| -3 | SI_MESGQ | Message queue signal | Sent from a message queue for inter-process communication. For example, when a process sends a message to a message queue, the kernel sends a MESGQ signal to the receiving process. |
| -4 | SI_ASYNCIO | Asynchronous I/O signal | Sent from an asynchronous I/O operation for non-blocking I/O operations. For example, when an I/O operation on a file descriptor is complete, the kernel sends an ASYNCIO signal to the process. |
| -5 | SI_SIGIO | Synchronous I/O signal | Sent from a synchronous I/O operation for blocking I/O operations. For example, when an I/O operation on a file descriptor is complete, the kernel sends a SIGIO signal to the process. |
| -6 | SI_TKILL | tkill() signal | Sent from the function tkill(), which is similar to the function kill(). Moreover, you can specify the ID of the thread that sends the signal using tkill(). It is usually used to send a signal to a specified thread in a multithreaded program. |
Restrictions
-
Processes are not advised to register signal handlers by themselves. After a process crashes, its exit may be delayed. If handling takes more than 5 seconds, the system may report the process as not responding.
-
The /data/log/faultlog/faultlogger directory stores a maximum of 10 CppCrash logs for a process or application. If the upper limit is reached, the earliest CppCrash logs of the process or application will be deleted. It is recommended that you view the CppCrash logs in a timely manner during development and debugging to prevent crash information loss due to log deletion.
-
The system has registered signal handlers for the preceding crash signals and signals 35, 38, and 42. It is recommended that you do not register signal handlers for these signals in applications. Otherwise, the system detection capability may fail.
-
By default, the asynchronous thread stack tracing functionality is enabled only in the ARM 64-bit system. For versions earlier than API version 22, the functionality of submitting asynchronous tasks by third-party and system applications through libuv and ffrt is enabled only in the debug version by default. Since API version 22, the functionality of submitting asynchronous tasks by third-party applications through libuv is enabled by default in both debug and release versions. The functionality of submitting asynchronous tasks by third-party and system applications through ffrt is enabled by default only in the debug version. For details about the crash log specifications, see Asynchronous Thread Stack Tracing Faults.
Obtaining Logs
Process crash logs are a type of fault logs. You can obtain them in any of the following ways:
Method 1: DevEco Studio
DevEco Studio collects process crash logs from /data/log/faultlog/faultlogger/ to FaultLog, where logs are displayed by process name and fault type. For details about how to obtain logs, see DevEco Studio User Guide-Fault Log.
Method 2: HiAppEvent APIs
HiAppEvent provides APIs for subscribing to faults. For details, see Introduction to HiAppEvent. You can subscribe to the crash event by referring to Subscribing to Crash Events (ArkTS) or Subscribing to Crash Events (C/C++), and read the fault log file content based on the external_log field of the event.
Method 3: hdc
Enable Developer options and run the hdc file recv /data/log/faultlog/faultlogger D:\ command to export fault logs to the local device. The fault log file name is in the format of cppcrash-process name-process UID-millisecond-level timestamp.log.
Log Specifications
The following table describes the fields in a fault log.
| Field | Description | Initial API Version | Mandatory | Optional |
|---|---|---|---|---|
| Device info | Device information. | 8 | Yes | - |
| Build info | Build information. | 8 | Yes | - |
| DeviceDebuggable | Whether the system version of the device can be debugged. | 23 | Yes | - |
| Fingerprint | Fault fingerprint. A hash value used to cluster similar issues. If different logs have the same hash value, they share the same fault cause. | 8 | Yes | - |
| Enabled app log configs | List of enabled configuration parameters. | 20 | No | This field is displayed only when it is configured by users. For details, see Application Crash Log Configured by HiAppEvent. |
| Module name | Module name. | 8 | Yes | - |
| ReleaseType | Application version type. | 23 | No | This field is displayed only for application processes. The value release indicates that the application is a release-type application, and the value debug indicates that the application is a debug-type application. |
| CpuAbi | ABI type. | 23 | No | This field is displayed only for application processes. |
| Version | App version (in dotted format). | 8 | No | Provided only in the application process. |
| VersionCode | App version (in integer format). | 8 | No | Provided only in the application process. |
| IsSystemApp | Whether the application is a system application. | 23 | No | This field is displayed only for application processes. |
| PreInstalled | Whether the app is preinstalled. | 8 | No | Provided only in the application process. |
| Foreground | Foreground/Background status. | 8 | No | This field is displayed only for application processes. |
| Page switch history | Page switching history. | 20 | No | If the maintenance and debugging service process is faulty or the switching history is not cached, this field is not displayed. For details, see Implementation Principles. |
| Timestamp | Fault occurrence timestamp. | 8 | Yes | - |
| Pid | Process ID. | 8 | Yes | - |
| Uid | User ID. | 8 | Yes | - |
| HiTraceId | HiTraceChain ID. | 20 | No | This field is provided only when the HiTraceChain feature is enabled for the faulty thread. For details, see Introduction to HiTraceChain. |
| Process name | Name of the faulty process. | 8 | Yes | - |
| App running unique id | Unique ID associated with the app at runtime. | 26.0.0 | Yes | - |
| Process life time | Lifetime of the faulty process. | 8 | Yes | - |
| Process Memory(kB) | Memory usage of the faulty process. | 20 | Yes | - |
| Device Memory(kB) | System memory information. | 20 | No | This field depends on the maintenance and debugging service process. If the maintenance and debugging service process stops or the device restarts when a fault occurs, this field does not exist. For details, see Implementation Principles. |
| Log source | Identifies how logs are collected. The following methods are available: processdump: Generated in user mode. pdump: Generated by the kernel as a fallback when user-mode cppcrash log generation fails. liteprocessdump: Generated in user mode when low-privilege processes (such as render or CPU) crash. Log specifications vary by collection method. For details, see Log Specification Differences Across Collection Methods. | 26.0.0 | Yes | - |
| Reason | Fault cause. | 8 | Yes | - |
| LastFatalMessage | Fatal message. | 8 | No | This field is shared by the following scenarios: Prompt information output when unreliable stack frame addresses are parsed. The last FATAL-level Hilog log saved when the process exits due to an ABORT signal crash. Internal system maintenance and debugging information. String information set by the app through OH_HiDebug_SetCrashObj. Starting from API version 26.0.0, if the app enables the module loading chain debugging switch, this field contains the module loading chain. |
| Fault thread info | Fault thread information. | 8 | Yes | - |
| SubmitterStacktrace | Submitter thread stack. | 12 | No | By default, the asynchronous thread stack tracing functionality is enabled only in the ARM 64-bit system. For versions earlier than API version 22, the functionality of submitting asynchronous tasks by third-party and system applications through libuv and ffrt is enabled only in the debug version by default. Since API version 22, the functionality of submitting asynchronous tasks by third-party applications through libuv is enabled by default in both debug and release versions. The functionality of submitting asynchronous tasks by third-party and system applications through ffrt is enabled by default only in the debug version. |
| Registers | Fault register. | 8 | Yes | - |
| Other thread info | Other thread information. | 8 | Yes | - |
| Memory near registers | Memory value near the fault register. | 8 | Yes | - |
| FaultStack | Fault thread stack memory information. | 8 | Yes | - |
| Maps | Memory space of the process when the fault occurs. | 8 | Yes | - |
| OpenFiles | File handle information held by the process when the fault occurs. | 12 | Yes | - |
| HiLog | HiLog logs printed before the fault occurs. A maximum of 1000 lines can be printed. | 8 | Yes | - |
| [truncated] | Fault log truncation flag. | 20 | No | This field is displayed when the fault log truncation size is configured and truncation occurs. |
| MergeLog | Log merge identifier for third-party apps. | 24 | No | Third-party app log identifier configured for merging app logs. |

Since API version 20, the cpsr register is added to the ARM32 architecture, the pstate and esr registers are added to the AArch64 architecture.
The log specifications vary slightly according to different fault scenarios. The following lists log specifications of seven scenarios:

In the following crash log examples, the text on the right of <- is used to explain the log format.
[h2]Common Faults
The following describes the common crash log specifications and other log specifications in special scenarios. This example is the core content of a process crash log archived by DevEco Studio in FaultLog.
Generated by HiviewDFX@HarmonyOS
================================================================
Device info:HarmonyOS 3.2   <- Device information.
Build info:HarmonyOS 5.1.0.101 <- Version information.
DeviceDebuggable:No <- Whether the system version of the device can be debugged.
Fingerprint:67bc4e29d8af56b6c0cbda154095949e83f3f1d6afe05bfc06c6cbb9f5591bb0 <- Fault characteristics.
Module name:com.example.myapplication <- Module name.
ReleaseType:debug <- Application version type..
CpuAbi:arm64-v8a <- ABI type.
Version:1.0.0 <- Application version number (dotted format).
VersionCode:1000000 <- Application version (integer).
IsSystemApp:No <- Whether the application is a system application.
PreInstalled:No <- Whether the application is pre-installed.
Foreground:Yes <- Whether the application is in the foreground or background.
Page switch history: <- Page switch history.
  11:43:21.840 :enters foreground
  11:43:17.317 :leaves foreground
  11:42:46.780 :enters foreground
Timestamp:2026-01-21 11:43:35.140 <- Timestamp when the fault occurs.
Pid:11941 <-Process ID
Uid:20020205 <- User ID
HiTraceId:a92ab1c7eae68fa <- HiTraceChain: unique tracing ID (This parameter is optional. If the faulty thread does not have HiTraceId, no information is displayed.)
Process name:com.example.myapplication <- Name of the faulty process.
Process life time:50s <- Life time of the faulty process.
Process Memory(kB): 185430(Rss) <- Memory usage of the faulty process.
Device Memory(kB): Total 11688288, Free 2427804, Available 5592064 <- Device memory status (optional).
Reason:Signal:SIGSEGV(SI_USER)@0x000000000000303e from:12350:0 <- Cause of the fault. For details, see the signal value description.
Fault thread info:           <- Faulty thread information.
Tid:11941, Name:.hiappeventtest <- Fault thread ID, thread name.
#00 pc 00000000001843f0 /system/lib/ld-musl-aarch64.so.1(epoll_wait+80)(6c643df40fcfff22745e25b37e2ca85b) <- Call stack. The call sequence is #06->#05->...->#00, and the crash occurs in the functions of #00.
#01 pc 0000000000021b74 /system/lib64/chipset-sdk-sp/libeventhandler.z.so(OHOS::AppExecFwk::EpollIoWaiter::WaitFor(std::__h::unique_lock<std::__h::mutex>&, long, bool)+232)(ed7ae4e867a4ab26cb8c67afc737116c)
#02 pc 00000000000273f8 /system/lib64/chipset-sdk-sp/libeventhandler.z.so(OHOS::AppExecFwk::EventQueue::WaitUntilLocked(std::__h::chrono::time_point<std::__h::chrono::steady_clock, std::__h::chrono::duration<long long, std::__h::ratio<1l, 1000000000l>>> const&, std::__h::unique_lock<std::__h::mutex>&, bool)+112)(ed7ae4e867a4ab26cb8c67afc737116c)
#03 pc 000000000002c358 /system/lib64/chipset-sdk-sp/libeventhandler.z.so(OHOS::AppExecFwk::EventQueueBase::GetEvent()+168)(ed7ae4e867a4ab26cb8c67afc737116c)
#04 pc 000000000001b148 /system/lib64/chipset-sdk-sp/libeventhandler.z.so(OHOS::AppExecFwk::(anonymous namespace)::EventRunnerImpl::Run()+808)(ed7ae4e867a4ab26cb8c67afc737116c)
#05 pc 000000000001fa04 /system/lib64/chipset-sdk-sp/libeventhandler.z.so(OHOS::AppExecFwk::EventRunner::Run()+356)(ed7ae4e867a4ab26cb8c67afc737116c)
#06 pc 00000000000f3a4c /system/lib64/platformsdk/libappkit_native.z.so(OHOS::AppExecFwk::MainThread::Start()+240)(e30f6c7f026034c7d6fa1692a05d3d69)
Registers:  <- Fault registers.
x0:fffffffffffffffc x1:0000007e5420ad60 x2:0000000000000008 x3:000000007fffffff
x4:0000000000000000 x5:0000000000000008 x6:575f45524f464542 x7:474e49544941575f
x8:0000000000000016 x9:0000000000000008 x10:0000007e5420ad60 x11:e18b0e5877a00005
x12:000000003b9ac9ff x13:007070632e72656e x14:2f72656c646e6168 x15:8f94b1d6208ca9b4
x16:0000005afeafe7d0 x17:0000005afb7f83a0 x18:000000000000000d x19:0000005b1b4dde10
x20:0000005b0c5fcf20 x21:0000005b1b4ddda0 x22:7fffffafde60b8cc x23:0000005b1b4ddda0
x24:0000007e5420af40 x25:0000000000000000 x26:0000000000000000 x27:00000055a511d354
x28:0000005b1a937bc8 x29:0000007e5420ad20
lr:0000005afeae1b78 sp:0000007e5420ad20 pc:0000005afb7f83f0
pstate:0000000020001000 esr:0000000000000000          <-  Status register (cpsr for the ARM32 architecture and pstate and esr for the AArch64 architecture).
Other thread info:      <- Other thread information.
Tid:12006, Name:OS_IPC_0_120064 <- Thread ID, thread name.
#00 pc 00000000001a4524 /system/lib/ld-musl-aarch64.so.1(ioctl+200)(6c643df40fcfff22745e25b37e2ca85b)
#01 pc 0000000000012044 /system/lib64/platformsdk/libipc_common.z.so(OHOS::BinderConnector::WriteBinder(unsigned long, void*)+120)(036a4c254e8f85b2af1c2a4f4d540e45)
#02 pc 0000000000070ae8 /system/lib64/platformsdk/libipc_single.z.so(OHOS::BinderInvoker::TransactWithDriver(bool)+284)(f9c345696cb6cee8d986e176f59f003d)
#03 pc 0000000000070ed8 /system/lib64/platformsdk/libipc_single.z.so(OHOS::BinderInvoker::StartWorkLoop()+100)(f9c345696cb6cee8d986e176f59f003d)
Memory near registers:  <-  Memory values near the address (which must be in valid memory) of the register at the fault site. The content in the brackets indicates the memory segment where the address in the register is located.
x1([stack]):         <- Memory value near the address of the r1 register at the fault site.
    0000007e5420ad50 0000000000000000
    0000007e5420ad58 0000005afeaec828
    0000007e5420ad60 0000000000000000
    0000007e5420ad68 0000000000000000
    ...
x10([stack]):
    0000007e5420ad50 0000000000000000
    0000007e5420ad58 0000005afeaec828
    0000007e5420ad60 0000000000000000
    0000007e5420ad68 0000000000000000
    0000007e5420ad70 0000000000000000
    ...
fp([stack]):
    0000007e5420ad10 7fffffafde60b8cc
    0000007e5420ad18 0000005b1b4ddda0
    0000007e5420ad20 0000007e5420ae70
    0000007e5420ad28 0000005afeae1b78
    ...
sp([stack]):
    0000007e5420ad10 7fffffafde60b8cc
    0000007e5420ad18 0000005b1b4ddda0
    0000007e5420ad20 0000007e5420ae70
    0000007e5420ad28 0000005afeae1b78
    ...
lr(/system/lib64/chipset-sdk-sp/libeventhandler.z.so):
    0000005afeae1a80 2a1f03e0940067e8
    0000005afeae1a88 b00000ef17ffff7c
    0000005afeae1a90 ca1d01eff945a5ef
    0000005afeae1a98 d503237fca1e01ef
    ...
pc(/system/lib/ld-musl-aarch64.so.1):
    0000005afb7f82f8 f9000bf3a9be7bfd
    0000005afb7f8300 f0001bc8910003fd
    0000005afb7f8308 aa0103eaaa0403e5
    0000005afb7f8310 93407c4993407c01
    ...
FaultStack: <- Stack of the crashed thread.
    0000007e5420ac20 0000007e00000072
    0000007e5420ac28 73615474736f5010
    0000007e5420ac30 0000007e5420006b
    0000007e5420ac38 ffffff80fffffff8
    ...
sp0:0000007e5420ad20 0000007e5420ae70 <- #Top position of the stack frame at 00 layer.
    0000007e5420ad28 0000005afeae1b78
    ...
sp1:0000007e5420ad40 0000007e5420aed0
    0000007e5420ad48 815c005afeaec858
    ...
sp2:0000007e5420aee0 0000007e5420af50
    0000007e5420aee8 7835005afeaec35c
    ...
sp3:0000007e5420af20 00000050219e3694
    0000007e5420af28 0000000000000000
    ...

Maps: <- Memory space of the process when the fault occurs.
55a511d000-55a5128000 r--p 00000000 /system/bin/appspawn
55a5128000-55a513b000 r-xp 0000a000 /system/bin/appspawn
55a513b000-55a513c000 r--p 0001c000 /system/bin/appspawn
55a513c000-55a513e000 rw-p 0001c000 /system/bin/appspawn
...
5b0c3cf000-5b0c64f000 rw-p 00000000 [anon:native_heap:jemalloc]
5b19605000-5b1d505000 rw-p 00000000 [anon:native_heap:jemalloc]
5b20100000-5b20107000 r--p 00000000 /system/lib64/platformsdk/libhdc_register.z.so
5b20107000-5b20110000 r-xp 00006000 /system/lib64/platformsdk/libhdc_register.z.so
5b20110000-5b20112000 r--p 0000e000 /system/lib64/platformsdk/libhdc_register.z.so
5b20112000-5b20113000 rw-p 0000f000 /system/lib64/platformsdk/libhdc_register.z.so
7e53a0d000-7e5420c000 rw-p 00000000 [stack]
7e55b92000-7e55b93000 rw-p 00000000 [anon:libark_tooling.so.bss]
OpenFiles: <- Information about the file handles held by the process when the fault occurs.
0->/dev/null native object of unknown type 0
1->/dev/null native object of unknown type 0
2->/dev/null native object of unknown type 0
3->socket:[2671] native object of unknown type 218115328
6->socket:[2793] native object of unknown type 0
36->/dev/urandom native object of unknown type 0

HiLog: <- HiLog logs of the process before the fault occurs.
01-21 11:43:35.140 11941 11941 I C02D11/DfxSignalHandler: DFX_SigchainHandler :: signo(11), si_code(0), pid(11941), tid(11941).
01-21 11:43:35.140 11941 11941 I C02D11/DfxSignalHandler: DFX_SigchainHandler :: signo(11), pid(11941), processName(com.example.hiappeventtest), threadName(.hiappeventtest).

MergeLog: <- Concatenated log provided by the application.
Last Modified: 2026-03-18 10:10:10 <- Last modification timestamp of the concatenated log provided by the application.
app crash log. <- Log generated by the application for concatenation.
HiTraceId
HiTraceId: Unique trace ID provided by HiTraceChain. For details, see Introduction to HiTraceChain.
Call stack frame
The following describes the content of a three-layer call stack in detail:
#00 pc 000e8400 /system/lib/ld-musl-arm.so.1(raise+176)(a40044d0acb68107cfc4adb5049c0725)
#01 pc 00006e95 /data/crasher_cpp(DfxCrasher::RaiseSegmentFaultException()+92)(d6cead5be17c9bb7eee2a9b4df4b7626)
#02 pc 00008909 /data/crasher_cpp(DfxCrasher::ParseAndDoCrash(char const*) const+612)(d6cead5be17c9bb7eee2a9b4df4b7626)
| Frame | Number of Offset Bytes of PC in the File | File Name of the Memory Segment to Which PC Belongs | Function | Number of Offset Bytes in the Function | BuildID |
|---|---|---|---|---|---|
| #00 | 000e8400 | /system/lib/ld-musl-arm.so.1 | raise | 176 | a40044d0acb68107cfc4adb5049c0725 |
| #01 | 00006e95 | /data/crasher_cpp | DfxCrasher::RaiseSegmentFaultException() | 92 | d6cead5be17c9bb7eee2a9b4df4b7626 |
| #02 | 00008909 | /data/crasher_cpp | DfxCrasher::ParseAndDoCrash(char const*) const | 612 | d6cead5be17c9bb7eee2a9b4df4b7626 |

-
The file name may also be an anonymous memory mapping, for example, [heap] or [stack].
-
The possible causes for the failure to print function names in logs are as follows:
-
The function name is not saved in the binary file.
-
The length of the function name saved in the binary file exceeds 256 bytes.
-
-
The function name is obtained by parsing the binary symbol table and MiniDebugInfo. Therefore, it may change with the version function name and compilation optimization.
-
If BuildID is not printed, you can run the readelf -n xxx.so command to check whether the binary file has BuildID. If not, add the compilation parameter --enable-linker-build-id to the compilation options. Do not add --build-id=none.
JS hybrid stack frame
The 64-bit ARM system can capture cross-language call stacks between C++ and JS. Therefore, if the function call chain contains JS code, the crash log also records the JS call stack in the following format:
#00 at onPageShow (entry|har1|1.0.0|src/main/ets/pages/Index.ts:7:13)
For details, see Exception Code Call Stack Formats.
[h2]Null Pointer Dereference
Null pointer dereference often occurs in the following scenarios:
-
When a crash is in the format of SIGSEGV(SEGV_MAPERR)@0x00000000 or the values of the registers such as r0 and r1 in the Register field are 0, a null pointer may be passed in when the function is called.
-
When a crash is in the format of SIGSEGV(SEGV_MAPERR)@0x0000000c (smaller than the size of a memory page) or the value of the registers such as r1 in the Register field is small, a null pointer may be passed in when the struct member of the input parameter is called.
In this scenario, a message is printed in the log, indicating that the fault may be caused by a null pointer dereference. The following is an example process crash log archived by DevEco Studio in FaultLog:
Generated by HiviewDFX@HarmonyOS
================================================================
Device info:HarmonyOS 3.2   <- Device information.
Build info:HarmonyOS 5.1.0.101 <- Version information.
DeviceDebuggable:No <- Whether the system version of the device can be debugged.
Fingerprint:125680eed3692695a944851a4e6e61500e9633c49224b68e02c0d6789a7e8c2a <- Fault characteristics
Module name:crasher_cpp            <- Module name.
Timestamp:2026-01-21 14:29:01.652  <- Timestamp when the fault occurs.
Pid:46314   <- Process ID.
Uid:0         <- User ID.
HiTraceId:a92ab1722d9f297  <-HiTraceChain: Unique tracing ID (This parameter is optional. If the faulty thread does not have HiTraceId, no information is displayed.)
Process name:./crasher_cpp         <- Name of the faulty process.
Process life time:1s               <- Life time of the faulty process.
Process Memory(kB): 8286(Rss)     <- Memory usage of the faulty process.
Device Memory(kB): Total 11688288, Free 2590168, Available 6153216 <- Device memory status (optional)
Reason:Signal:SIGSEGV(SEGV_MAPERR)@0x0000000000000004  probably caused by NULL pointer dereference   <- Fault cause and null pointer prompt.
Fault thread info:
Tid:46314, Name:crasher_cpp         <- Thread ID, thread name.
#00 pc 000000000001092c /data/crasher_cpp(TestNullPointerDereferenceCrash0()+48)(16bde6cdd3f8bb6d20de4e68c210ee7c)
#01 pc 000000000000bd50 /data/crasher_cpp(DfxCrasher::ParseAndDoCrash(char const*) const+616)(16bde6cdd3f8bb6d20de4e68c210ee7c)
#02 pc 000000000000c530 /data/crasher_cpp(main+1160)(16bde6cdd3f8bb6d20de4e68c210ee7c)
#03 pc 00000000000af9b0 /system/lib/ld-musl-aarch64.so.1(libc_start_main_stage2+80)(6c643df40fcfff22745e25b37e2ca85b)
Registers:   <- Fault registers.
x0:0000005704762398 x1:0000007e60d9d8ac x2:0000000000000001 x3:0000005b2efaa268
x4:00000057047620c1 x5:0000005b2f288ea9 x6:6e696f506c6c754e x7:6665726544726574
x8:0000000000000004 x9:13a5bcd2d1efb552 x10:0000005b2efaa290 x11:503a3a65636e6572
x12:626d654d746e6972 x13:3a65756c61567265 x14:000000000000000c x15:0000000000000000
x16:0000005704773120 x17:0000005b2ef6cb94 x18:0000000000000000 x19:0000007e60d9d940
x20:0000007e60d9d9a8 x21:0000007e60d9d909 x22:0000005704771c68 x23:000000570476fba8
x24:000000570476fc40 x25:0000000000000d20 x26:0000000000000001 x27:0000005b2efa6000
x28:0000005b2efaa838 x29:0000007e60d9d8f0
lr:000000570476d920 sp:0000007e60d9d8f0 pc:000000570476d92c
pstate:0000000060001000 esr:0000000092000005          <-  Status register (cpsr for the ARM32 architecture and pstate and esr for the AArch64 architecture)
...
[h2]Stack Overflow
Stack overflow may occur in the following scenarios:
-
The stack memory is used up because the recursive termination condition is not set during recursive call.
-
The stack memory is used up because local variables occupy too much stack memory.
-
The stack memory used in the signal stack exceeds the system limit.
The following example shows that the stack memory is used up because the recursive termination condition is not set during recursive call.
static void *DoStackOverflow(void * inputArg) __attribute__((optnone))
{
    int b[10] = {1};
    if (b[0] == 0) {
        return static_cast<void*>(b + 9); // 9: last element of array
    }
    DoStackOverflow(inputArg); // Recursive calls are made multiple times. As a result, the stack memory is used up, and memory is read and written outside the stack, causing a crash.
    return static_cast<void*>(b + 9); // 9: last element of array
}
In this scenario, a message is recorded in the log, indicating that the fault may be caused by stack overflow. The following is an example process crash log archived by DevEco Studio in FaultLog:
Generated by HiviewDFX@HarmonyOS
================================================================
Device info:HarmonyOS 3.2   <- Device information.
Build info:HarmonyOS 5.1.0.101 <- Version information.
DeviceDebuggable:No <- Whether the system version of the device can be debugged.
Fingerprint:efeb9bc182c8eedd0cb5672809fcc02a2ceb65050589c1512ce30cd62469ed03  <- Fingerprint.
Module name:crasher_cpp                <- Module name.
Timestamp:2026-01-21 14:32:29.539      <- Timestamp when the fault occurs.
Pid:47049                            <- Process ID.
Uid:0                                  <- User ID.
HiTraceId:a92ab1c7eae68fa <- HiTraceChain: Unique tracing ID (This parameter is optional. If the faulty thread does not have HiTraceId, no information is displayed.)
Process name:./crasher_cpp             <- Name of the faulty process.
Process life time:2s                   <- Life time of the faulty process.
Process Memory(kB): 8306(Rss)     <- Memory usage of the faulty process.
Device Memory(kB): Total 11688288, Free 2595812, Available 6161408 <- Device memory status (optional).
Reason:Signal:SIGSEGV(SEGV_ACCERR)@0x0000005b517d3fd0  current thread stack low address = 0x0000005b517d4000, probably caused by stack-buffer-overflow    <- Fault cause and stack overflow prompt.
Fault thread info:
Tid:47050, Name:crasher_cpp
#00 pc 000000000000a11c /data/crasher_cpp(DoStackOverflow(void*)+36)(16bde6cdd3f8bb6d20de4e68c210ee7c)
#01 pc 000000000000a15c /data/crasher_cpp(DoStackOverflow(void*)+100)(16bde6cdd3f8bb6d20de4e68c210ee7c)
#02 pc 000000000000a15c /data/crasher_cpp(DoStackOverflow(void*)+100)(16bde6cdd3f8bb6d20de4e68c210ee7c)
#03 pc 000000000000a15c /data/crasher_cpp(DoStackOverflow(void*)+100)(16bde6cdd3f8bb6d20de4e68c210ee7c)
#04 pc 000000000000a15c /data/crasher_cpp(DoStackOverflow(void*)+100)(16bde6cdd3f8bb6d20de4e68c210ee7c)
#05 pc 000000000000a15c /data/crasher_cpp(DoStackOverflow(void*)+100)(16bde6cdd3f8bb6d20de4e68c210ee7c)
...
[h2]Stack Corruptions
Stack corruptions occur when the stack memory that stores function call information is overwritten during service code running. As a result, the call stack cannot be traced. In this scenario, the system displays a message in the log, indicating that you need to parse the unreliable call stack in the thread stack memory from #xx. The call stack is unreliable because it may not be a complete function call chain. From level #xx downward, adjacent frames do not necessarily reflect a true call relationship. You must deduce the actual sequence from the service source. In the following example, the correct call relationship is #05 -> #04 -> #03 -> #01. The following is an example process crash log archived by DevEco Studio in FaultLog:
Generated by HiviewDFX@HarmonyOS
================================================================
Device info:HarmonyOS 3.2   <- Device information.
Build info:HarmonyOS 5.1.0.101 <- Version information.
DeviceDebuggable:No <- Whether the system version of the device can be debugged.
Fingerprint:494b19375266bbefaa667b860e9404317deae24200320b2b8afbe2781476167c <- Fault feature ID.
Module name:crasher_cpp                   <- Module name.
Timestamp:2026-01-21 14:42:02.675 <- Timestamp when the fault occurs.
Pid:49315                                 <- Process ID.
Uid:0                                     <- User ID.
HiTraceId:a92ab1753aa4af0 <- HiTraceChain unique trace ID (Optional. If the fault thread does not have HiTraceId, it is not printed.)
Process name:./crasher_cpp                <- Name of the faulty process.
Process life time:1s                      <- Life time of the faulty process.
Process Memory(kB): 8245(Rss)            <- Memory usage of the faulty process.
Device Memory(kB): Total 11688288, Free 2570076, Available 6149120 <- Device memory status (optional).
Reason:Signal:SIGILL(ILL_ILLOPN)@000000000000000000 <- Cause of fault.
LastFatalMessage:Failed to unwind stack, try to get unreliable call stack from #01 by reparsing thread stack <- #00 and #01 are generally considered reliable. You need to parse unreliable call stacks in the thread stack memory from #02.
Fault thread info:
Tid:49315, Name:crasher_cpp               <- Thread ID, thread name.
#00 pc 00000000000096b0 /data/crasher_cpp(RecursiveHelperFunction(int, int, int)+160)(16bde6cdd3f8bb6d20de4e68c210ee7c)
#01 pc 0000000000009650 /data/crasher_cpp(RecursiveHelperFunction(int, int, int)+64)(16bde6cdd3f8bb6d20de4e68c210ee7c)
#02 pc 000000000000968c /data/crasher_cpp(RecursiveHelperFunction(int, int, int)+124)(16bde6cdd3f8bb6d20de4e68c210ee7c)
#03 pc 000000000000968c /data/crasher_cpp(RecursiveHelperFunction(int, int, int)+124)(16bde6cdd3f8bb6d20de4e68c210ee7c)
#04 pc 000000000000968c /data/crasher_cpp(RecursiveHelperFunction(int, int, int)+124)(16bde6cdd3f8bb6d20de4e68c210ee7c)
#05 pc 000000000000968c /data/crasher_cpp(RecursiveHelperFunction(int, int, int)+124)(16bde6cdd3f8bb6d20de4e68c210ee7c)
...
Registers:
x0:0000000000000000 x1:0000000000000000 x2:0000000000000000 x3:0000007f7264b180
x4:0000007f7264b200 x5:0000000000000004 x6:3162343632376637 x7:3030316234363237
x8:0000000000000100 x9:0000000000000000 x10:0000000000000078 x11:0000000000000000
x12:0000007f7264ada8 x13:00000059ece0863d x14:0000000000000001 x15:0000000000000000
x16:00000059ee950538 x17:00000059ecf2b880 x18:0000000000000000 x19:0000000000000000
x20:0000000000000000 x21:0000007f7264b909 x22:00000056855f8b18 x23:00000056855f6ba8
x24:00000056855f6c40 x25:0000000000000e70 x26:0000000000000001 x27:00000059ecfea000
x28:00000059ecfee838 x29:0000000000000000
lr:0000000000000000 sp:0000007f7264b120 pc:00000056855ed6b0
pstate:0000000060001000 esr:0000000000000000
...
[h2]Asynchronous Thread Stack Tracing Faults
When an asynchronous thread crashes, the stack of the thread that submitted the asynchronous task is also printed, helping locate crash issues caused by the asynchronous task submitter. The call stack of the crashing thread and the call stack of its submitting thread are separated by the SubmitterStacktrace string.
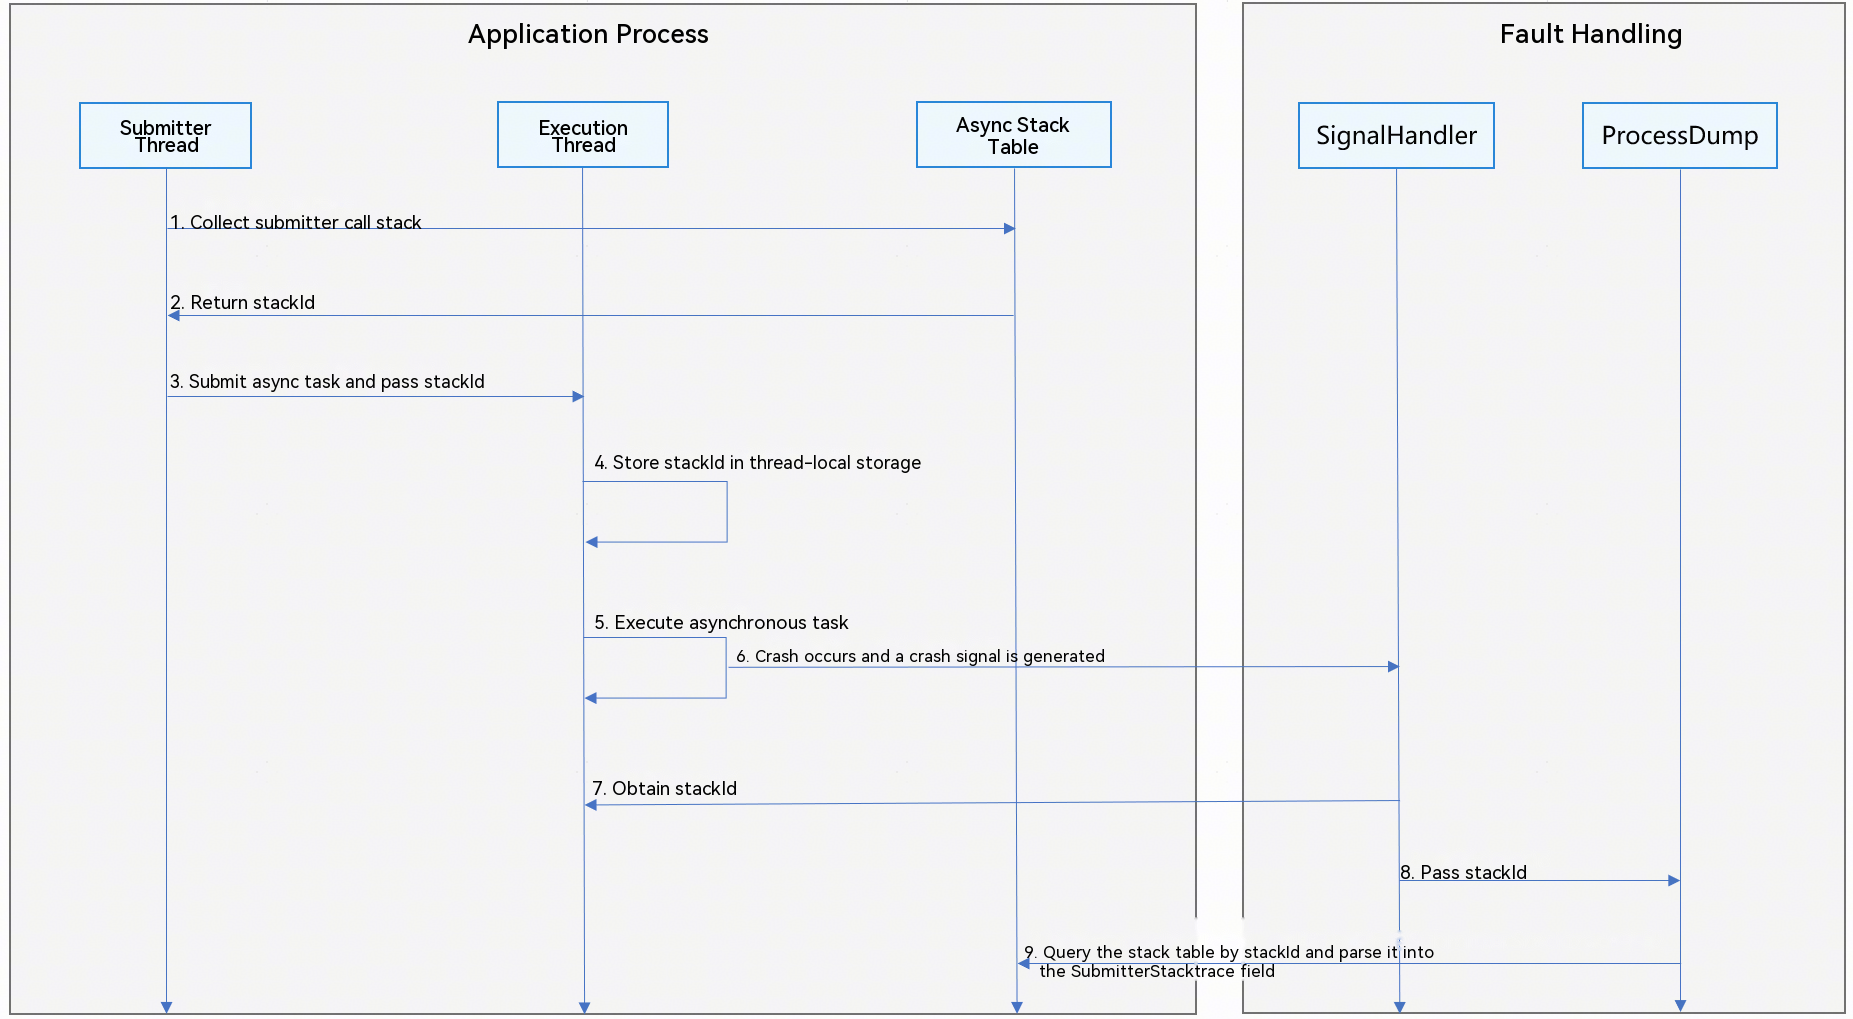
Asynchronous Thread Stack Generation Principle
The following figure illustrates the principle.
-
The submitting thread collects its own call stack information and saves it to the asynchronous stack table in a specific memory area of the process.
-
After the record is saved, the asynchronous stack table returns a unique identifier stackId.
-
The submitting thread submits the asynchronous task and passes the identifier stackId.
-
Before executing the task, the execution thread saves stackId to the thread-local storage area.
-
The execution thread starts executing the asynchronous task.
-
The execution thread crashes during the execution of the asynchronous task, generating a crash signal.
-
The signal handler obtains the stackId saved in the thread-local storage area through the GetStackId function.
-
The signal handler passes stackId to the backtrace process processdump.
-
processdump reads the asynchronous stack table across processes, queries and obtains the call stack information of the submitting thread based on the stackId value, and fills it into the corresponding SubmitterStacktrace field of the fault log.
The following is the core content of a process crash log archived by DevEco Studio in FaultLog.

By default, the asynchronous thread stack tracing functionality is enabled only in the ARM 64-bit system.
For versions earlier than API version 22, the functionality of submitting asynchronous tasks by third-party and system applications through libuv and ffrt is enabled only in the debug version by default.
Since API version 22, the functionality of submitting asynchronous tasks by third-party applications through libuv is enabled by default in both debug and release versions. The functionality of submitting asynchronous tasks by third-party and system applications through ffrt is enabled by default only in the debug version.
Generated by HiviewDFX@HarmonyOS
================================================================
Device info:HarmonyOS 3.2   <- Device information.
Build info:HarmonyOS 5.1.0.101 <- Version information.
DeviceDebuggable:No <- Whether the system version of the device can be debugged.
Fingerprint:8bc3343f50024204e258b8dce86f41f8fcc50c4d25d56b24e71fe26c0a23e321  <- Fingerprint.
Module name:com.example.uv001 <- Module name.
ReleaseType:release <- Application version type.
CpuAbi:armeabi-v7a <- Binary API type.
Version:1.0.0 <- Application version number (dotted format).
VersionCode:1000000 <- Application version (integer).
IsSystemApp:No <- Whether the application is a system application.
PreInstalled:No <- Whether the application is pre-installed.
Foreground:Yes <- Whether the application is in the foreground or background.
Page switch history: <- Page switch history.
10:09:06.006 :enters foreground
Timestamp:2026-01-08 11:25:46.000  <- Timestamp when the fault occurs.
Pid:28421                                   <- Process ID.
Uid:20020214                                <- User ID.
HiTraceId:a92ab1c7eae68fa <- HiTraceChain unique tracing ID (This parameter is optional. If the faulty thread does not have HiTraceId, no information is displayed.)
Process name:com.example.uv001              <- Name of the faulty process.
Process life time:42s                        <- Life time of the faulty process.
Process Memory(kB): 151736(Rss)            <- Memory usage of the faulty process.
Device Memory(kB): Total 11712088, Free 2500232, Available 5275648 <- Device memory status (optional).
Reason:Signal:SIGABRT(SI_TKILL)@0x01317bf600006f05  from:28421:20020214  <- Fault cause.
Fault thread info:
Tid:29192, Name:OS_FFRT_2_0 <- Fault thread ID, thread name.
#00 pc 00000000001bfa74 /system/lib/ld-musl-aarch64.so.1(raise+216)(2f1b32d70ef466b15265fd08a0eca91e)  <- Call stack.
#01 pc 0000000000001ff8 /data/storage/el1/bundle/libs/arm64/libentry.so(7869adbb6ed8ae9fed544fa0eb2883f9a22d3bc5)
#02 pc 0000000000013694 /system/lib64/platformsdk/libuv.so(uv__queue_work+60)(f78cf9546cece23d7b088a751ff98497)
#03 pc 0000000000093224 /system/lib64/ndk/libffrt.so(ffrt::UVTask::Execute()+744)(4f907cee9caa17cf5d72826c09f13f10)
#04 pc 000000000008e784 /system/lib64/ndk/libffrt.so(ffrt::ExecuteTask(ffrt::TaskBase*)+248)(4f907cee9caa17cf5d72826c09f13f10)
#05 pc 000000000002ed3c /system/lib64/ndk/libffrt.so(ffrt::CPUWorker::RunTask(ffrt::TaskBase*,ffrt::CPUWorker*)+84)(4f907cee9caa17cf5d72826c09f13f10)
#06 pc 00000000000c87b0 /system/lib64/ndk/libffrt.so(4f907cee9caa17cf5d72826c09f13f10)
#07 pc 00000000001dfbf0 /system/lib/ld-musl-aarch64.so.1(start+240)(2f1b32d70ef466b15265fd08a0eca91e)
========SubmitterStacktrace========       <- The call stack used to print submitting thread.
#00 pc 0000000000013590 /system/lib64/platformsdk/libuv.so(uv_queue_work+304)(f78cf9546cece23d7b088a751ff98497)
#01 pc 0000000000001f74 /data/storage/el1/bundle/libs/arm64/libentry.so(7869adbb6ed8ae9fed544fa0eb2883f9a22d3bc5)
#02 pc 000000000006a258 /system/lib64/platformsdk/libace_napi.z.so(panda::JSValueRefArkNativeFunctionCallBack<true>(panda::JsiRuntimeCallInfo*)+296)(23225c16f1721ec4629f9788305fc487)
#03 pc 0000000000e7f46c /system/lib64/module/arkcompiler/stub.an(RTStub_PushCallArgsAndDispatchNative+44)
#04 pc 00000000004854c0 /system/lib64/module/arkcompiler/stub.an(BCStub_HandleCallthis2Imm8V8V8V8StwCopy+440)
#05 at func_main_0 (entry|entry|1.0.0|src/main/ets/pages/Index.ts:72:10)
#06 pc 0000000000366444 /system/lib64/platformsdk/libark_jsruntime.so(panda::ecmascript::EcmaInterpreter::Execute(panda::ecmascript::EcmaRuntimeCallInfo*)+800)(6e93189f3a9e33adb9455beb7c675df6)
#07 pc 0000000000803fcc /system/lib64/platformsdk/libark_jsruntime.so(6e93189f3a9e33adb9455beb7c675df6)
#08 pc 0000000000804da4 /system/lib64/platformsdk/libark_jsruntime.so(panda::ecmascript::EcmaVM::InvokeEcmaEntrypoint(panda::ecmascript::JSPandaFile const*,std::__h::basic_string<char,std::__h::char_traits<char>,panda::ecmascript::CAddressAllocator<char>> const&,panda::ecmascript::ExecuteTypes const&)+776)(6e93189f3a9e33adb9455beb7c675df6)
#09 pc 000000000049d0f4 /system/lib64/platformsdk/libark_jsruntime.so(6e93189f3a9e33adb9455beb7c675df6)
#10 pc 000000000039735c /system/lib64/platformsdk/libark_jsruntime.so(panda::ecmascript::SourceTextModule::ModuleExecution(panda::ecmascript::JSThread*,panda::ecmascript::JSHandle<panda::ecmascript::SourceTextModule> const&,void const*,unsigned long, panda::ecmascript::ExecuteTypes const&)+1108)(6e93189f3a9e33adb9455beb7c675df6)
#11 pc 00000000003db718 /system/lib64/platformsdk/libark_jsruntime.so(6e93189f3a9e33adb9455beb7c675df6)
#12 pc 00000000003dacc0 /system/lib64/platformsdk/libark_jsruntime.so(panda::ecmascript::SourceTextModule::Evaluate(panda::ecmascript::JSThread*,panda::ecmascript::JSHandle<panda::ecmascript::SourceTextModule> const&,void const*,unsigned long,panda::ecmascript::ExecuteTypes const&)+736)(6e93189f3a9e33adb9455beb7c675df6)
#13 pc 00000000005ac534 /system/lib64/platformsdk/libark_jsruntime.so(6e93189f3a9e33adb9455beb7c675df6)
#14 pc 00000000005abbec /system/lib64/platformsdk/libark_jsruntime.so(6e93189f3a9e33adb9455beb7c675df6)
#15 pc 0000000000644acc /system/lib64/platformsdk/libark_jsruntime.so(6e93189f3a9e33adb9455beb7c675df6)
...
[h2]Application Crash Log Configured by HiAppEvent
The system provides a general crash log generation feature, but some apps require custom log content. Therefore, starting from API version 20, you can configure custom log content through the setEventConfig API.
The following is the core content of a system crash log archived by DevEco Studio in FaultLog:
...
Build info:HarmonyOS 5.0.0.23
...
Enabled app log configs:    <- List of enabled configuration parameters. Only the configuration parameters that are not set to the default values are printed.
Extend pc lr printing:true  <- Set extend_pc_lr_printing to true.
Log cut off size:102400B    <- Truncate the crash log size to 100 KB. (This field is valid only for crash logs obtained through the HiAppEvent API.)
Simplify maps printing:true <- Set simplify_vma_printing to true.
Timestamp:2026-01-08 11:25:46.000
...
Registers:  <- Fault registers
x0:fffffffffffffffc x1:0000007e5420ad60 x2:0000000000000008 x3:000000007fffffff
x4:0000000000000000 x5:0000000000000008 x6:575f45524f464542 x7:474e49544941575f
x8:0000000000000016 x9:0000000000000008 x10:0000007e5420ad60 x11:e18b0e5877a00005
x12:000000003b9ac9ff x13:007070632e72656e x14:2f72656c646e6168 x15:8f94b1d6208ca9b4
x16:0000005afeafe7d0 x17:0000005afb7f83a0 x18:000000000000000d x19:0000005b1b4d4d50
x20:0000005b0c5fcf20 x21:0000005b1b4d4ce0 x22:7fffa71517841b1d x23:0000005b1b4d4ce0
x24:0000007e5420af40 x25:0000000000000000 x26:0000000000000000 x27:00000055a511d354
x28:0000005b1a937bc8 x29:0000007e5420ad20
lr:0000005afeae1b78 sp:0000007e5420ad20 pc:0000005afb7f83f0
pstate:0000000020001000 esr:0000000000000000
Memory near registers:
...
lr(/system/lib64/chipset-sdk-sp/libeventhandler.z.so): <- Memory value near the lr register address.
    0000005afeae1a80 2a1f03e0940067e8 <- When extend_pc_lr_printing is set to true, the memory value is printed forward to this point.
    ...
    0000005afeae1b68 910083e19a89b103 <- When extend_pc_lr_printing is set to false, the memory value is printed forward to this point.
    0000005afeae1b70 9400680b52800102
    0000005afeae1b78 885ffe682a0003f7 <- Memory value (885ffe682a0003f7) of the lr register address (0000005afeae1b78)
    ...
    0000005afeae1c60 52801002d10243a1 <- When extend_pc_lr_printing is set to false, the memory value is printed backward to this point.
    0000005afeae1c68 ad3c83a0ad3b83a0
    0000005afeae1c70 ad3e83a0ad3d83a0
    0000005afeae1c78 94006799b9400000 <- When extend_pc_lr_printing is set to true, the memory value is printed backward to this point.
pc(/system/lib/ld-musl-aarch64.so.1): <- Memory value near the PC.
    0000005afb7f82f8 f9000bf3a9be7bfd <- When extend_pc_lr_printing is set to true, the memory value is printed forward to this point.
    ...
    0000005afb7f83e0 aa1f03e4aa0403e3 <- When extend_pc_lr_printing is set to false, the memory value is printed forward to this point.
    0000005afb7f83e8 d400000152800105
    0000005afb7f83f0 eb00811fb25453e8 <- Memory value (eb00811fb25453e8) of the PC register address (0000005afb7f83f0)
    ...
    0000005afb7f84d8 aa0903e152800260 <- When extend_pc_lr_printing is set to false, the memory value is printed backward to this point.
    0000005afb7f84e0 d63f0100f9439508
    0000005afb7f84e8 a9be7bfd17ffffe6
    0000005afb7f84f0 910003fdf9000bf3 <- When extend_pc_lr_printing is set to true, the memory value is printed backward to this point.
...
Maps:       <- When simplify _vma_printing is set to true, the number of maps to be printed is reduced. Only the maps to which the addresses in the crash log belong are retained.
55a511d000-55a5128000 r--p 00000000 /system/bin/appspawn
55a5128000-55a513b000 r-xp 0000a000 /system/bin/appspawn
55a513b000-55a513c000 r--p 0001c000 /system/bin/appspawn
55a513c000-55a513e000 rw-p 0001c000 /system/bin/appspawn
... <- Maps to which the addresses in the crash logs belong, which are not displayed here.
OpenFiles:
...
[truncated] <- Log truncation flag, indicating that the log is truncated.
[h2]Faults with Page Switching History
Since API version 20, the maintenance and debugging process records the app switching history for apps that involve page switching. After an app fault occurs, the generated fault file contains the page switching history.
A maximum of 10 latest history records can be recorded in a fault log file.
...
Foreground:Yes
Page switch history:
  14:08:30:327 /ets/pages/Index:JsError
  14:08:28:986 /ets/pages/Index
  14:08:07:606 :leaves foreground
  14:08:06:246 /ets/pages/Index:AppFreeze
  14:08:01:955 :enters foreground
Timestamp:2025-08-20 14:08:30:327
Pid:10208
Uid:0
...
The format of a record is as follows:
  14:08:30:327 /ets/pages/Index:JsError
       ^             ^            ^
Switching time Page URL Page name 
The child page's name is available only when it is navigated to through Navigation. The page name is defined in System Routing Table.
When the application switches between the foreground and background, the corresponding page URL is empty, but enters foreground and leaves foreground are displayed as special page names.
enters foreground: The application runs in the foreground.
leaves foreground: The application runs in the background.
[h2]Clustering Introduction
Cpp Crash logs generated by an application in different versions or at different times in the same version may have the same root cause. However, most information in Cpp Crash logs changes with the version, time, and other factors, making it difficult to quickly identify duplicate issues.
Cpp Crash fault information contains both system-side and application-side call stacks, which makes it harder for you to quickly locate application-side issues.
To avoid repeated analysis of multiple fault logs and improve analysis efficiency, Cpp Crash fault information needs to be clustered.
Clustering also helps you classify and collect statistics on issues with different causes.
[h2]Clustering Scope
The fault thread information in a Cpp Crash log indicates the code call information when a service thread fails. The same fault thread call stack always indicates the same fault cause.
Therefore, using fault thread information as the clustering scope is the most accurate approach. You can add other fault log information based on service-specific clustering requirements.
In a Cpp Crash log, fault thread information starts from Fault thread info: and ends before Registers:, as shown below:
...
Fault thread info:
Tid:10208, Name:crasher_cpp
#00 pc 000e8400 /system/lib/ld-musl-arm.so.1(raise+176)(a40044d0acb68107cfc4adb5049c0725)
#01 pc 00008cdc /data/storage/el1bundle/libs/arm64/libsample.so(8b74cdc906ea6b2eba95d891bc91c72a)
#02 pc 0005ae00 /system/lib/platformsdk/libace_napi.z.so(panda::JSValueRef ArkNativeFunctionCallBack<true>(panda::JsiRuntimeCallInfo*)+272)(bc1c64aabbe5c7d4db2282a6137443e1)
#03 pc 00de3efc /system/lib/module/arkcompiler/stub.an(RTStub_PushCallArgsAndDispatchNative+44)
#04 pc 00448dd4 /system/lib/module/arkcompiler/stub.an(BCStub_HandleCallthis0Imm8V8StwCopy+372)
#05 at triggerCrash (sample|sample|1.0.0|src/main/ets/pages/CppCrash.ts:49:25)
#06 at onPageShow (sample|sample|1.0.0|src/main/ets/pages/Index.ts:381:36)
#07 pc 001e5c8c /system/lib/platformsdk/libark_jsruntime.so(ce0b05d90b9fae02e7abf8e9f1e5a0f3)
...
Registers:
...
[h2]Extracting Clustering Information
Fault thread information mainly consists of call stack information, in addition to the thread name and thread ID. You can use regular expressions to match and filter stack content.
Since system and application versions may differ, call stacks may contain change-prone information such as line numbers, byte offsets, and Build IDs. Therefore, the information needs to be extracted and filtered.
You are advised to perform the following operations on each stack frame.
Normalize native stack frames:
| Original Stack Frame Content | Normalized Stack Frame Content |
|---|---|
| #02 pc 0005ae00 /system/lib/platformsdk/libace_napi.z.so(panda::JSValueRef ArkNativeFunctionCallBack<true>(panda::JsiRuntimeCallInfo*)+272)(bc1c64aabbe5c7d4db2282a6137443e1) | /system/lib/platformsdk/libace_napi.z.so(panda::JSValueRef ArkNativeFunctionCallBack<true>(panda::JsiRuntimeCallInfo*)+272) |
Process the stack frame as follows:
a. Remove the frame number.
b. Remove the PC offset and Build ID.
c. Retain the file path, for example, /system/lib/platformsdk/libace_napi.z.so.
d. Retain the full function signature, for example, panda::JSValueRef ArkNativeFunctionCallBack<true>(panda::JsiRuntimeCallInfo*)+272, which is the content in parentheses, including the class name, function name, parameters, const, and parameter types.
If a native stack frame contains only a binary file name and no function name, you can retain the PC offset and file path.
| Original Stack Frame Content | Normalized Stack Frame Content |
|---|---|
| #01 pc 00008cdc /data/storage/el1bundle/libs/arm64/libsample.so(8b74cdc906ea6b2eba95d891bc91c72a) | 00008cdc /data/storage/el1bundle/libs/arm64/libsample.so |
Normalize JS stack frames:
| Original Stack Frame Content | Normalized Stack Frame Content |
|---|---|
| #06 at onPageShow (sample|sample|1.0.0|src/main/ets/pages/Index.ts:381:36) | onPageShow (sample|sample|1.0.0|src/main/ets/pages/Index.ts:381:36) |
Process the stack frame as follows:
a. Remove the line number.
b. Retain the function name, for example, onPageShow.
c. Retain the file path, line number, and column number, for example, src/main/ets/pages/Index.ts:381:36.
d. Retain the module name, dependency module name, and version information, for example, sample|sample|1.0.0|.
[h2]Extracting Clustering Features
After normalization, the stack may still contain many frames, which is not ideal for storage and query after clustering. You need to define a clustering feature extraction method based on service requirements to further simplify stack frame information into clustering features.
The following method is recommended.
1. Filter basic libraries and exception stack frames.
Filter stack frames that contain any of the following fields:
libc.so
libc++.so
ld-musl-aarch64.so
libc_fdleak_debug.so
unknown
watchdog
kthread
rdr_system_error
libart.so
__switch_to
dump_backtrace
show_stack
dump_stack
panic
libace_napi.z.so
libarkjs_runtime.z.so
2. Filter system stack frames and select service stack frames.
System library stack frames start with /system/lib or /system/lib64. Example:
/system/lib/platformsdk/libace_napi.z.so(panda::JSValueRef ArkNativeFunctionCallBack\<true\>(panda::JsiRuntimeCallInfo*)+272)
Service stack frames start with at or contain /data or /data/storage.
JS stack frames are service stack frames by default. Example:
at onPageShow (sample|sample|1.0.0|src/main/ets/pages/Index.ts:381:36)
Native stack frame of an application:
00008cdc /data/storage/el1bundle/libs/arm64/libsample.so
3. Select key stack frames.
Extract a small number of stack frames in order as clustering features. For example, retain only the first, second, and last stack frames as feature information.
You can define filtering conditions based on service requirements, as long as the feature information remains consistent for the same fault.
[h2]Generating Clustering Features
The final clustering feature is a service call stack sequence that contains a small number of normalized stack frames.
| Original Fault Thread Stack | Final Clustering Feature (Call Order from Top to Bottom) |
|---|---|
| #00 pc 000e8400 /system/lib/ld-musl-arm.so.1 (raise+176)(a40044d0acb68107cfc4adb5049c0725) #01 pc 00008cdc /data/storage/el1bundle/libs/arm64/libsample.so (8b74cdc906ea6b2eba95d891bc91c72a) #02 pc 0005ae00 /system/lib/platformsdk/libace_napi.z.so (panda::JSValueRef ArkNativeFunctionCallBack<true>(panda::JsiRuntimeCallInfo*)+272)(bc1c64aabbe5c7d4db2282a6137443e1) #03 pc 00de3efc /system/lib/module/arkcompiler/stub.an(RTStub_PushCallArgsAndDispatchNative+44) #04 pc 00448dd4 /system/lib/module/arkcompiler/stub.an(BCStub_HandleCallthis0Imm8V8StwCopy+372) #05 at triggerCrash (sample|sample|1.0.0|src/main/ets/pages/CppCrash.ts:49:25) #06 at onPageShow (sample|sample|1.0.0|src/main/ets/pages/Index.ts:381:36) #07 pc 001e5c8c /system/lib/platformsdk/libark_jsruntime.so(ce0b05d90b9fae02e7abf8e9f1e5a0f3) | 00008cdc /data/storage/el1bundle/libs/arm64/libsample.so triggerCrash (sample|sample|1.0.0|src/main/ets/pages/CppCrash.ts:49:25) onPageShow (sample|sample|1.0.0|src/main/ets/pages/Index.ts:381:36) |
You can classify and collect statistics on Cpp Crash issues by comparing clustering features extracted from multiple fault logs.
You can also use the Fingerprint field in the current fault log as a reference, calculate a hash value for the clustering feature content to generate a fault feature identifier, and then classify and collect statistics on Cpp Crash issues based on the identifier.
Log Specification Differences Across Collection Methods
| Field | Description | processdump | pdump | liteprocessdump |
|---|---|---|---|---|
| Device info | Device information | Yes | Yes | Yes |
| Build info | Build information | Yes | Yes | Yes |
| DeviceDebuggable | Whether the system version of the device is debuggable | Yes | Yes | Yes |
| Fingerprint | Fault fingerprint, a hash value for clustering similar issues. The same hash value indicates the same fault cause. | Yes | Yes | Yes |
| Enabled app log configs | List of enabled configuration parameters | Yes | No | No |
| Module name | Module name | Yes | Yes | Yes |
| ReleaseType | Release type of the app | Yes | Yes | Yes |
| CpuAbi | Binary interface type | Yes | Yes | Yes |
| Version | App version number (dotted format) | Yes | Yes | Yes |
| VersionCode | App version number (integer format) | Yes | Yes | Yes |
| IsSystemApp | Whether the app is a system app | Yes | Yes | Yes |
| PreInstalled | Whether the app is pre-installed | Yes | Yes | Yes |
| Foreground | Foreground/background status | Yes | Yes | Yes |
| Page switch history | Page switch history | Yes | Yes | Yes |
| Timestamp | Timestamp when the fault occurred | Yes | Yes | Yes |
| Pid | Process ID | Yes | Yes | Yes |
| Uid | User ID | Yes | Yes | Yes |
| HiTraceId | Unique trace ID of HiTraceChain | Yes | No | No |
| Process name | Fault process name | Yes | Yes | Yes |
| App running unique id | Unique ID associated with the app runtime | Yes | No | Yes |
| Process life time | Lifetime of the fault process | Yes | Yes | Yes |
| Process Memory(kB) | Memory usage of the fault process | Yes | Yes | Yes |
| Device Memory(kB) | Overall device memory status | Yes | Yes | Yes |
| Log source | Identifies the log collection method | Yes | Yes | Yes |
| Reason | Fault cause | Yes | Yes | Yes |
| LastFatalMessage | Fatal message | Yes | No | No |
| Fault thread info | Fault thread information | Yes | Yes | Yes |
| SubmitterStacktrace | Submitter thread stack | Yes | No | No |
| Registers | Registers at the fault site | Yes | Yes | Yes |
| ExtraCrashInfo | Additional memory information | Yes | No | No |
| Other thread info | Other thread information | Yes | Yes | Yes |
| Memory near registers | Memory values near registers at the fault site | Yes | Yes | Yes |
| FaultStack | Fault thread stack memory information | Yes | Yes | Yes |
| Maps | Memory space of the process at the time of fault | Yes | Yes | Yes |
| OpenFiles | File handle information held by the process at the time of fault | Yes | No | Yes |
| HiLog | Running logs printed before the fault, up to 1000 lines | Yes | Yes | Yes |
| [truncated] | Fault log truncation flag | Yes | Yes | Yes |
| MergeLog | Third-party app merged log identifier | Yes | No | No |
[h2]What should I do if the call stack is interrupted in the fault log?
In HarmonyOS, the call stack is obtained based on the backtrace table (which records call stack information) and frame pointer. The following compilation options must be enabled:
-
-funwind-tables
Instructs the compiler to generate a backtrace table in the binary for exception handling and call stack backtracing.
-
-fno-omit-frame-pointer
Instructs the compiler to store the stack frame pointer in a register for exception handling and call stack backtracing.
Enabling Compilation Options
For example, you can add set(CMAKE_CXX_FLAGS "${CMAKE_CXX_FLAGS} -fno-omit-frame-pointer -funwind-tables") in CMakeLists.txt.
[h2]What should I do if the app exits due to a SIGPIPE exception?
Starting from API version 24, when an application exits due to a SIGPIPE exception, you can enable call stack printing for SIGPIPE signals. After restarting the application, reproduce the issue to collect call stack information and output it to HILOG.

The key log for SIGPIPE exception exit is as follows:
App bundle name with pid xxxx exit with signal:13
-
SIGPIPE signal description
Signo Signal Description Trigger Cause 13 SIGPIPE Illegal operation on a pipe or socket - Pipe or named pipe (FIFO): The write end writes to the pipe, but the read end has been closed.
- Socket: After the client disconnects, the server still attempts to write data to the closed connection.
-
Enable the SIGPIPE debug switch.
Run the following command in the DevEco Studio terminal: hdc shell param set hilog.signal.stack.on SIGPIPE. Restart the application after the command is executed. The setting becomes invalid after the device restarts.
-
Verify that the feature is enabled.
Filter logs in HILOG by using the keyword C02D11. If the filtered logs contain information about the line where the exception occurs, the call stack feature has been enabled successfully.
The following example uses the testSIGPIPE() function to construct a SIGPIPE exception scenario:
#include <unistd.h>
#include <signal.h>

int testSIGPIPE()
{
    sigset_t set, oldset;
    // Initialize the signal set and add the signal to be temporarily unblocked.
    sigemptyset(&set);
    sigaddset(&set, SIGPIPE);
    // Save the current signal mask first.
    if (sigprocmask(SIG_SETMASK, NULL, &oldset) != 0) {
        return -1;
    }
    // Temporarily unblock the signal.
    if (sigprocmask(SIG_UNBLOCK, &set, NULL) != 0) {
        return -1;
    }
    // After creating the pipe, close the read end first, then continue writing to the write end to construct a SIGPIPE exception scenario.
    int pipe[2]{-1};
    if (pipe2(pipe, 0) != 0) {
        return -1;
    }
    close(pipe[0]);
    int src = 1;
    write(pipe[1], reinterpret_cast<const void*>(&src), sizeof(int));
    close(pipe[1]);

    // Finally, restore the original mask.
    if (sigprocmask(SIG_SETMASK, &oldset, NULL) != 0) {
        return -1;
    }
    return 0;
}
Filter the logs. If the call stack shows that the exception occurs in testSIGPIPE(), the feature is enabled successfully.
...
03-06 13:55:25.876   20440-20440   C02D11/process...fxFaultLogger  pid-20440             I     Timestamp:2026-03-06 13:55:25.382
03-06 13:55:25.876   20440-20440   C02D11/process...fxFaultLogger  pid-20440             I     Pid:19787
03-06 13:55:25.876   20440-20440   C02D11/process...fxFaultLogger  pid-20440             I     Uid:20020208
03-06 13:55:25.876   20440-20440   C02D11/process...fxFaultLogger  pid-20440             I     Process name:com.example.myapplication
03-06 13:55:25.876   20440-20440   C02D11/process...fxFaultLogger  pid-20440             I     Process life time:12s
03-06 13:55:25.876   20440-20440   C02D11/process...fxFaultLogger  pid-20440             I     Process Memory(kB): 172773(Rss)
03-06 13:55:25.876   20440-20440   C02D11/process...fxFaultLogger  pid-20440             I     Reason:Signal:SIGPIPE(SI_USER)from:19787:20020208
03-06 13:55:25.876   20440-20440   C02D11/process...fxFaultLogger  pid-20440             I     Fault thread info:
03-06 13:55:25.876   20440-20440   C02D11/process...fxFaultLogger  pid-20440             I     Tid:19787, Name:e.myapplication
03-06 13:55:25.876   20440-20440   C02D11/process...fxFaultLogger  pid-20440             I     #00 pc 00000000001e8150 /system/lib/ld-musl-aarch64.so.1(write+68)(90776dcdb3f38042fc78b97d93138bde)
03-06 13:55:25.876   20440-20440   C02D11/process...fxFaultLogger  pid-20440             I     #01 pc 0000000000001cf8 /data/storage/el1/bundle/libs/arm64/libentry.so(testSIGPIPE()+228)(d6af99a8111f4c2761800cb1432bea140f5176e4)
03-06 13:55:25.876   20440-20440   C02D11/process...fxFaultLogger  pid-20440             I     #02 pc 0000000000001e34 /data/storage/el1/bundle/libs/arm64/libentry.so(d6af99a8111f4c2761800cb1432bea140f5176e4)
...
[h2]Crash Fault Caused by Memory Problems
Problem
Crash logs contain the following information:
-
The fault information contains LastFatalMessage: This is an unexpected memory usage behavior.
-
The fault message does not contain LastFatalMessage, but the top of the call stack of the faulty thread is jemalloc calling ld-musl-aarch64.so.1(crash_brk+0).
Possible Causes
The preceding log information indicates that a memory access exception occurs, which triggers the crash. The possible causes of the crash are as follows:
-
Double Free: After memory deallocation is successful, special flags (6b) are written to the deallocated memory. When the memory is released again, these flags are detected. As a result, a crash is triggered.
-
Use After Free (UAF): After memory deallocation is successful, data is read or written again. Because a special flag (6b) is written after memory deallocation, a crash is triggered when data is read or written again. 6b can be found in the crash log.
In conclusion, you can check whether the corresponding memory has a special flag (6b) in the crash log triggered by a memory problem to determine whether the memory address has been released by jemalloc.
Solution
If the preceding symptoms are found in the fault log information, search for the special flag (6b) based on the memory information in the fault information, find the corresponding memory address, and analyze and rectify the Double Free or UAF fault based on the code.
The following is a Double Free case. The code snippet is as follows:
// ...
// Enable the jemalloc cache to ensure that the memory flag is written.
mallopt(M_OHOS_CONFIG, M_TCACHE_PERFORMANCE_MODE);
mallopt(M_OHOS_CONFIG, M_ENABLE_OPT_TCACHE);
mallopt(M_SET_THREAD_CACHE, M_THREAD_CACHE_ENABLE);
char* test = (char*)malloc(4096);
// The test address is displayed in the log to facilitate the query of the memory content in the crash log.
std::cout << "test addr: " << std::hex << test << std::endl;
free(test);
free(test); // Double Free
// ...
View the generated crash logs.
Generated by HiviewDFX@HarmonyOS
================================================================
Device info:HUAWEI Mate 70
Build info:CLS-AL00 6.1.0.263(C00E1R4P3DEVDUlog)
DeviceDebuggable:Yes
Fingerprint:27af54212714ee9cc5026e020716783795c2ae8434730476532415be04f0277d
Module name:test_processdump
Timestamp:2026-01-14 19:52:53.207
Pid:43588
Uid:0
Process name:./test_processdump
Process life time:1s
Process Memory(kB): 18497(Rss)
Device Memory(kB): Total 11688320, Free 704432, Available 6171648
Reason:Signal:SIGTRAP(TRAP_BRKPT)@0x0000005a6cabe068
LastFatalMessage:This is an unexpected memory usage behavior.may double free   ----> Crash caused by memory problems occurred.
Fault thread info:
Tid:43588, Name:test_processdum
#00 pc 00000000000b3068 /system/lib/ld-musl-aarch64.so.1(cache_bin_dalloc_safety_checks+108)(f4bc554163a467382fbc9026ef320fb7)
#01 pc 00000000000bfd38 /system/lib/ld-musl-aarch64.so.1(je_free+408)(f4bc554163a467382fbc9026ef320fb7)
#02 pc 00000000000515c8 /data/test/test_processdump((anonymous namespace)::ProcessDumpTest_DfxProcessTest008_Test::TestBody()+260)(bcace1bb3be03ebd7b59c921eb0c9f42)
#03 pc 00000000000ca924 /data/test/test_processdump(testing::internal::UnitTestImpl::RunAllTests()+6676)(bcace1bb3be03ebd7b59c921eb0c9f42)
#04 pc 00000000000c8d44 /data/test/test_processdump(testing::UnitTest::Run()+120)(bcace1bb3be03ebd7b59c921eb0c9f42)
#05 pc 00000000000b11bc /data/test/test_processdump(main+100)(bcace1bb3be03ebd7b59c921eb0c9f42)
#06 pc 00000000000afe58 /system/lib/ld-musl-aarch64.so.1(libc_start_main_stage2+80)(f4bc554163a467382fbc9026ef320fb7)
Registers:
x0:0000000000000000 x1:0000000000000000 x2:0000005a6cc1f1e0 x3:0000007f43f875a0
x4:0000005a6cefdbf0 x5:0000007f43f87580 x6:0000007f43f87580 x7:3030306361326436
x8:0000000000000000 x9:0000005a6f452fc4 x10:0000000000000000 x11:0000005a6f452f68
x12:000000000000001f x13:0000007f43f875c8 x14:0000000000000000 x15:0000000000000000
x16:0000005a6f451a38 x17:0000005a6cbfa3cc x18:0000000000000000 x19:0000005a6d2ac000
x20:0000005a6cabdc50 x21:0000005a6d2a21d8 x22:0000005a6ce2a000 x23:0000005a6d2a2228
x24:0000005a6f447778 x25:0000005a6d29ab00 x26:20c49ba5e353f7cf x27:0000000000000005
x28:0000000000000001 x29:0000007f43f87610
lr:0000005a6cabe094 sp:0000007f43f87610 pc:0000005a6cabe068
pstate:0000000040001000 esr:00000000f2000001
...
x19([anon:native_heap:jemalloc]):
    0000005a6d2abff0 0000000000000000
    0000005a6d2abff8 0000000000000000
    0000005a6d2ac000 6b6b195687b5f541   ---->  Memory address 6b6b195687b5f541 indicates that the address has been released.
    0000005a6d2ac008 0000000000000000
    0000005a6d2ac010 0000000000000000
    0000005a6d2ac018 0000000000000000
    0000005a6d2ac020 0000000000000000
    0000005a6d2ac028 0000000000000000
    0000005a6d2ac030 0000000000000000
    0000005a6d2ac038 0000000000000000
    0000005a6d2ac040 0000000000000000
    0000005a6d2ac048 0000000000000000
    0000005a6d2ac050 0000000000000000
    0000005a6d2ac058 0000000000000000
    0000005a6d2ac060 0000000000000000
    0000005a6d2ac068 0000000000000000
    0000005a6d2ac070 0000000000000000
    0000005a6d2ac078 0000000000000000
    0000005a6d2ac080 0000000000000000
The memory address 5a6d2ac000 is filled with bytes starting with 6b, indicating that the address has been released. Check the logs generated when the program is running.
test addr: 5a6d2ac000
The memory address of the test pointer is 5a6d2ac000, indicating that the test pointer is double free. Find the corresponding code to fix the problem of repeated pointer release.