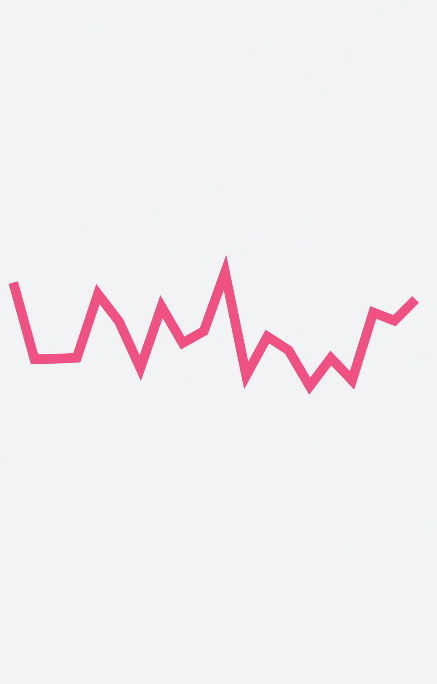
The <chart> component displays line charts, bar charts, and gauge charts. For details, see chart.
Creating a <chart> Component
Create a <chart> component in the .hml file under pages/index.
<!-- xxx.hml -->
<div class="container">
  <chart class="chart-data" type="line" options="{{lineOps}}" datasets="{{lineData}}"></chart>
</div>
/* xxx.css */
.container {
width: 100%;
height: 100%;
flex-direction: column;
justify-content: center;
align-items: center;
background-color: #F1F3F5;
}
.chart-data {
width: 700px;
height: 600px;
} // xxx.js
export default {
data: {
lineData: [
{
data: [763, 550, 551, 554, 731, 654, 525, 696, 595, 628, 791, 505, 613, 575, 475, 553, 491, 680, 657, 716]
}
],
lineOps: {
xAxis: {
min: 0,
max: 20,
display: false,
},
yAxis: {
min: 0,
max: 1000,
display: false,
},
series: {
lineStyle: {
width: 15,
},
}
},
}
} 
Setting the Chart Type
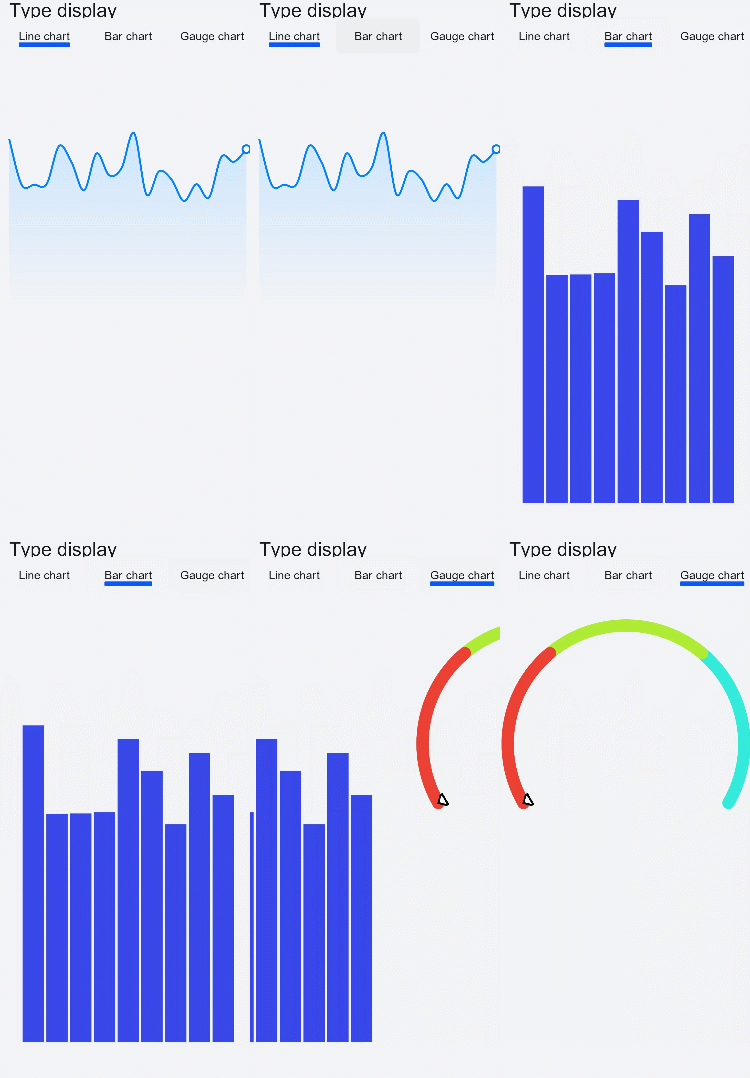
Define the chart type using the type attribute, for example, setting a chart to a bar chart.
<!-- xxx.hml -->
<div class="container">
  <div class="container">
    <div class="switch-block">
      <text class="title">
        {{ title }}
      </text>
    </div>
    <tabs class="tabs" index="0" vertical="false" onchange="changes">
      <tab-content class="tabcontent" scrollable="true">
        <tabs >
          <tab-bar class="tab-bar" mode="fixed"style="margin-bottom: 50px;">
            <text class="tab-text">Line chart</text>
            <text class="tab-text">Bar chart</text>
            <text class="tab-text">Gauge chart</text>
          </tab-bar>
          <tab-content>
            <div class="bar-block" style="margin-left: 30px;">
              <chart class="chart-data" type="line" ref="linechart" options="{{ lineOps }}" datasets="{{ lineData }}">
              </chart>
            </div>
            <div class="bar-block">
              <chart class="data-bar" type="bar" id="bar-chart" options="{{ barOps }}" datasets="{{ barData }}">
              </chart>
            </div>
            <div class="chart-block">
              <chart type="gauge" ></chart>
            </div>
          </tab-content>
        </tabs>
      </tab-content>
    </tabs>
  </div>
</div>
/* xxx.css */
.container {
width: 100%;
height: 100%;
flex-direction: column;
justify-content: center;
background-color: #F1F3F5;
}
.tab-bar{
background-color: #F1F3F5;
}
.chart-data {
width: 700px;
height: 600px;
}
.title{
margin-left: 50px;
margin-top: 50px;
font-size: 50px;
}
.line-block{
align-items: center;
justify-content: center;
}
.bar-block{
align-items: center;
justify-content: center;
}
.chart-block{
width: 90%;
margin-left: 30px;
} // xxx.js
export default {
data: {
title: "Type display",
barData: [
{
fillColor: '#3848e8',
data: [763, 550, 551, 554, 731, 654, 525, 696, 595],
}
],
lineData: [
{
strokeColor: '#0081ff',
fillColor: '#cce5ff',
data: [763, 550, 551, 554, 731, 654, 525, 696, 595, 628, 791, 505, 613, 575, 475, 553, 491, 680, 657, 716],
gradient: true,
}
],
lineOps: {
xAxis: {
min: 0,
max: 20,
display: false,
},
yAxis: {
min: 0,
max: 1000,
display: false,
},
series:{
lineStyle: {
width: "5px",
smooth: true,
},
headPoint: {
shape:"circle",
size: 20,
strokeWidth: 5,
fillColor: '#ffffff',
strokeColor: '#007aff',
display: true,
},
loop:{
margin: 2,
gradient: true
}
},
},
barOps: {
xAxis: {
min: 0,
max: 20,
display: false,
axisTick: 10,
},
yAxis: {
min: 0,
max: 1000,
},
},
},
} 

The <chart> component does not display the value of each point.
Setting the Chart Attributes
In the options attribute of the <chart> component, you can set the x-axis, y-axis, and data series parameters. In the datasets attribute, you can set the line color, fill color, gradient fill color, and drawing point set.
<!-- xxx.hml -->
<div class="container">
  <chart class="chart-data" type="line" options="{{lineOps}}" datasets="{{lineData}}"></chart>
</div>
/* xxx.css */
.container {
width: 100%;
height: 100%;
flex-direction: column;
justify-content: center;
align-items: center;
background-color: #F1F3F5;
}
.chart-data {
width: 700px;
height: 600px;
} // xxx.js
export default {
data: {
// Line chart data
lineData: [
{
strokeColor: '#0081ff',
fillColor: '#cce5ff', // Fill color
data: [463, 250, 251, 254, 431, 354, 225, 396, 295, 328, 491, 205, 313, 275, 475, 553, 491, 380, 357, 416],
gradient: true,
}
],
lineOps: {
// X-axis settings
xAxis: {
min: 0,
max: 20,
display: false,
},
// Y-axis settings
yAxis: {
min: 0,
max: 1000,
display: false,
},
// Data series settings
series: {
// Line style settings
lineStyle: {
width: "5px",
smooth: true,
},
// Style and size of the white dot at the front of the line
headPoint: {
shape: "circle",
size: 20,
strokeWidth: 5,
fillColor: '#ffffff',
strokeColor: '#007aff',
display: true,
},
// Whether to restart drawing from the beginning when the screen is full.
loop: {
margin: 2,
gradient: true
}
}
},
},
} 
-
The options attribute supports the settings of bar charts and line charts but does not support those of gauge charts.
-
The datasets attribute supports the datasets for bar charts and line charts but does not support those of gauge charts.
-
Only line charts support series.
Example Scenario
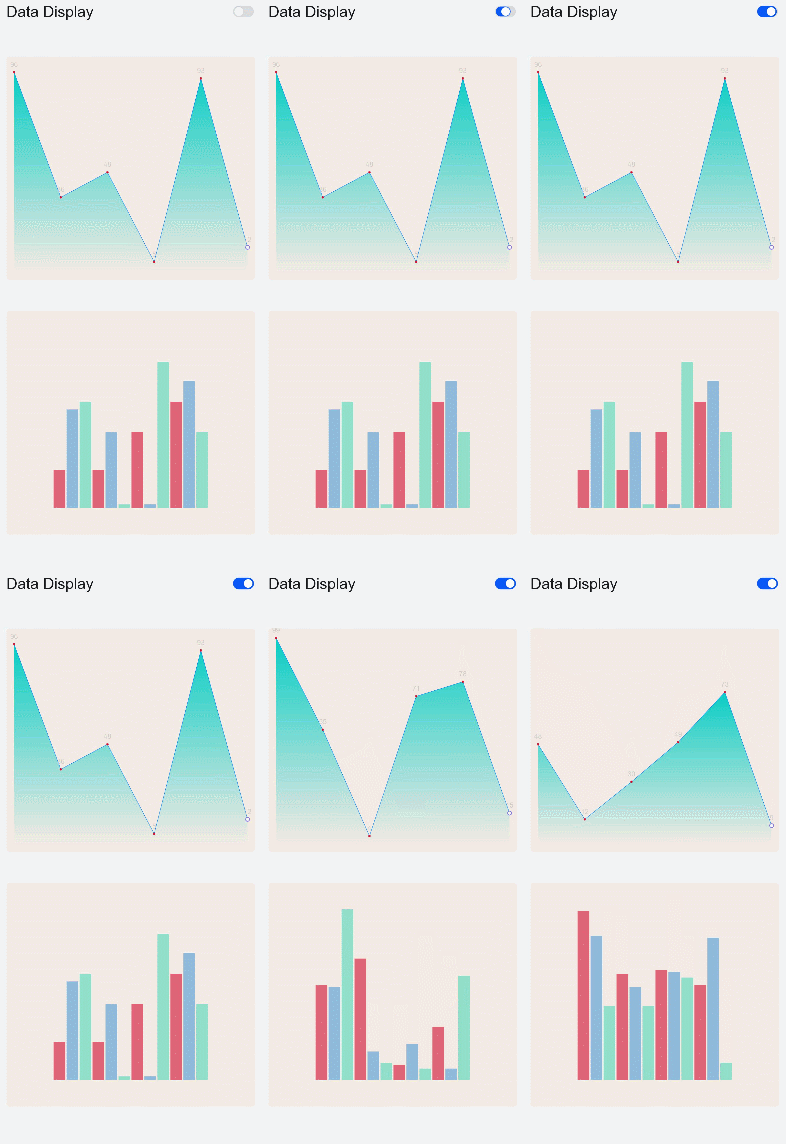
Select the data display status using <switch>. When <switch> is set to true, the timer is used to dynamically display data.
<!-- xxx.hml -->
<div class="container">
  <div class="container">
    <div class="switch-block">
      <text class="title">{{ title }} </text>
      <switch class="switch" showtext="{{ showText }}" allow-scale="{{ allowScale }}"onchange="change">
      </switch>
    </div>
    <tabs class="tabs" index="0" vertical="false" onchange="changes">
      <tab-content class="tabcontent" scrollable="true">
        <div>
          <tabs class="tabs" index="0" vertical="false" onchange="changes">
            <tab-content class="tabcontent" scrollable="true">
              <div class="line-class">
                <div class="bar-block">
                  <chart class="chart-data" type="line" ref="linechart" options="{{ lineOps }}"
                  datasets="{{ lineData }}">
                  </chart>
                </div>
                <div class="bar-block">
                  <chart class="data-bar" type="bar" id="bar-chart" options="{{ barOps }}"datasets="{{ barData }}">
                  </chart>
                </div>
             </div>
           </tab-content>
         </tabs>
       </div>
       <div>
         <div class="container">
           <list class="todo-wrapper">
             <list-item for="{{ barData }}" class="todo-item">
               <text class="todo-title">{{ $item.data }}</text>
             </list-item>
           </list>
           <list class="todo-wrapper">
             <list-item for="{{ lineData.data }}" class="todo-item">
               <text class="todo-title">{{ $item.value }}</text>
             </list-item>
           </list>
         </div>
       </div>
      </tab-content>
    </tabs>
  </div>
</div>
/* xxx.css */
.container{
display:flex;
flex-direction:column;
background-color: #F1F3F5;
}
.line-class{
display: flex;
flex-direction: column;
}
.title{
font-size: 40px;
margin-left: 40px;
}
.switch-block {
margin-top: 30px;
width: 98%;
height: 80px;
display: flex;
justify-content: space-between;
}
.switch{
font-size: 40px;
}
.bar-block {
margin-top: 80px;
margin-left: 40px;
position: relative;
width: 90%;
border-radius: 10px;
background-color: #25FAB27B;
height: 40%;
justify-content: center;
} // xxx.js
export default {
data: {
interval: null,
title: "Data display",
allowScale: true,
dataLength: 30,
barGroup: 3,
lineData: null,
lineOps: {
xAxis: {
min: 0,
max: 5
},
yAxis: {
min: 0,
max: 100
},
series: {
lineStyle: {
width: '1px',
},
headPoint: {
shape: 'circle',
size: 10,
strokeWidth: 2,
fillColor: '#ffffff',
strokeColor: '#8477DF'
},
loop: {
margin: 2
}
}
},
barData: [
{
fillColor: '#97CF0A2C',
data: [20, 20, 40, 56]
},
{
fillColor: '#6D0A7ACF',
data: [52, 40, 2, 67]
},
{
fillColor: '#6A0ACFA1',
data: [56, 2, 77, 40]
}
],
barOps: {
xAxis: {
min: 0,
max: 20,
axisTick: 5
},
yAxis: {
min: 0,
max: 100
}
}
},
onInit() {
this.changeLine();
},
change(e) {
if (e.checked) {
this.interval = setInterval(() => {
this.changeLine();
this.changeBar();
}, 1000)
} else {
clearInterval(this.interval);
}
},
changeLine() {
var dataArray = [];
for (var i = 0; i < this.dataLength; i++) {
var nowValue = Math.floor(Math.random() * 99 + 1);
var obj = {
"value": nowValue,
"description": nowValue + "",
"textLocation": "top",
"textColor": "#CDCACA",
"pointStyle": {
"shape": "circle",
"size": 5,
"fillColor": "#CF0A2C",
"strokeColor": "#CF0A2C"
}
};
dataArray.push(obj);
}
this.lineData = [
{
strokeColor: '#0081ff',
fillColor: '#FF07CDC4',
data: dataArray,
gradient: true,
}
]
},
changeBar() {
for (var i = 0;i < this.barGroup; i++) {
var dataArray = this.barData[i].data;
for (var j = 0;j < 4; j++) {
dataArray[j] = Math.floor(Math.random() * 99 + 1);
}
}
this.barData = this.barData.splice(0, this.barGroup + 1);
},
changes(e) {
console.info("Tab index: " + e.index);
},
onDestroy() {
if (this.interval) {
clearInterval(this.interval);
}
},
}