Introduction to Network Packet Analysis
Network packet analysis is a debugging capability provided by HarmonyOS. You can install Wireshark on a Windows PC to analyze network packets from a device. Network communication debugging is a common requirement in mobile app development. The network packet analysis feature provides a plug-and-play solution: simply connect a phone or tablet to a PC via USB to capture network packets from the device on the PC. Typical use cases include debugging app network requests (such as HTTP, HTTPS, and WebSocket), analyzing network protocols (such as TCP and UDP), and troubleshooting network performance issues.

This feature is supported starting from 26.0.0.
[h2]Capabilities
- Real-time traffic mirroring: You can view network requests from a phone or tablet in real time in Wireshark on a Windows PC, without installing any packet capture tool on the phone or tablet.
- Transparent packet capture: Packet capture is transparent to apps on the phone or tablet. No app adaptation is required, and packet capture does not affect normal app operation or network communication quality.
- Multi-protocol support: Supports transport-layer protocols such as TCP, UDP, and ICMP, as well as application-layer protocols such as HTTP, HTTPS, and DNS. Requests and responses of common network protocols can be fully parsed.
[h2]Highlights
- Plug and play
After the device is connected via USB, the system automatically detects the device and creates an Ethernet adapter. No manual driver installation or complex configuration is required. Enable network packet analysis in Developer options to immediately view network packets in Wireshark.
- Real-time analysis
With low latency, this feature is suitable for scenarios that require real-time observation of network requests, debugging of persistent WebSocket connections, or analysis of DNS resolution, enabling quick troubleshooting. Wireshark can also be used to export captured packets to a pcap file for further analysis.
[h2]Function Restrictions
- Developer options must be enabled on the phone or tablet.
- Before network packet analysis is enabled, the phone or tablet must be connected to a Windows PC using a USB cable.
[h2]Network Packet Analysis Status
| Status | Description | Operation |
|---|---|---|
| On | Network packets are being captured. | Can be manually turned off. |
| Off | Network packets are not being captured. | Can be turned on after a USB connection is established. |
| Unavailable (grayed out) | USB is not connected, and the feature cannot be used. | Can be turned on after USB is connected. |
[h2]Prerequisites
- Connect the phone or tablet to a Windows PC using a USB cable.
- Install Wireshark on the Windows PC. Version 4.4.3 or later is recommended.
[h2]Operations on the Device
Step 1: Access Developer options
When using this feature for the first time, follow Enabling Developer Options to enable Developer mode on the device. Then go to Settings > System > Developer options.
Step 2: Connect the device via USB
- Connect the device to the PC using a USB cable.
- In the USB connection dialog box displayed on the device, select an appropriate connection mode. Charge only is recommended.

If the network packet analysis switch in Developer options is grayed out (unavailable), check whether the USB connection is working properly.
Step 3: Enable network packet analysis
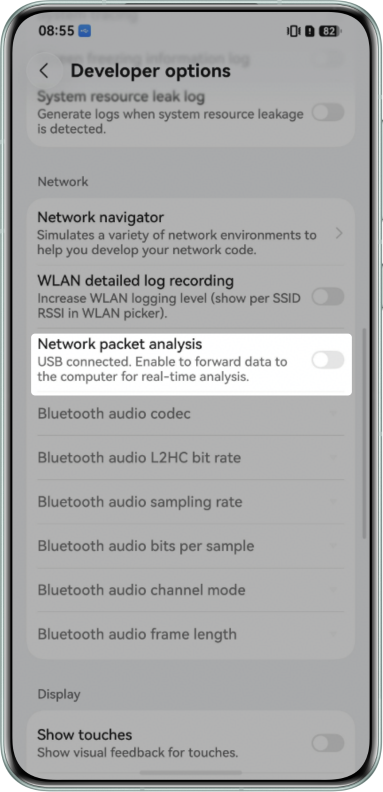
- Find Network packet analysis in Developer options.
- Tap the switch and confirm the operation in the dialog box to enable the feature.
- After the feature is enabled, the capsule-shaped live view displays a message indicating that packet analysis is running, and network packets from the device are captured in Wireshark on the Windows PC.

- If network packet analysis is enabled while USB debugging is in use, USB debugging is automatically disabled.
- If USB debugging is enabled during packet capture, network packet analysis is automatically disabled.
- When the USB connection is disconnected, the switch is automatically grayed out (unavailable). After reconnecting the device via USB, you can enable the feature again.
[h2]Operations on the Windows PC (Packet Capture with Wireshark)
Step 1: Identify the Ethernet adapter
- Open Wireshark.
- In the network adapter list, locate the Ethernet adapter added after network packet analysis is enabled. It is typically displayed as Ethernet x (for example, Ethernet 2).
- Note the name of the Ethernet adapter.
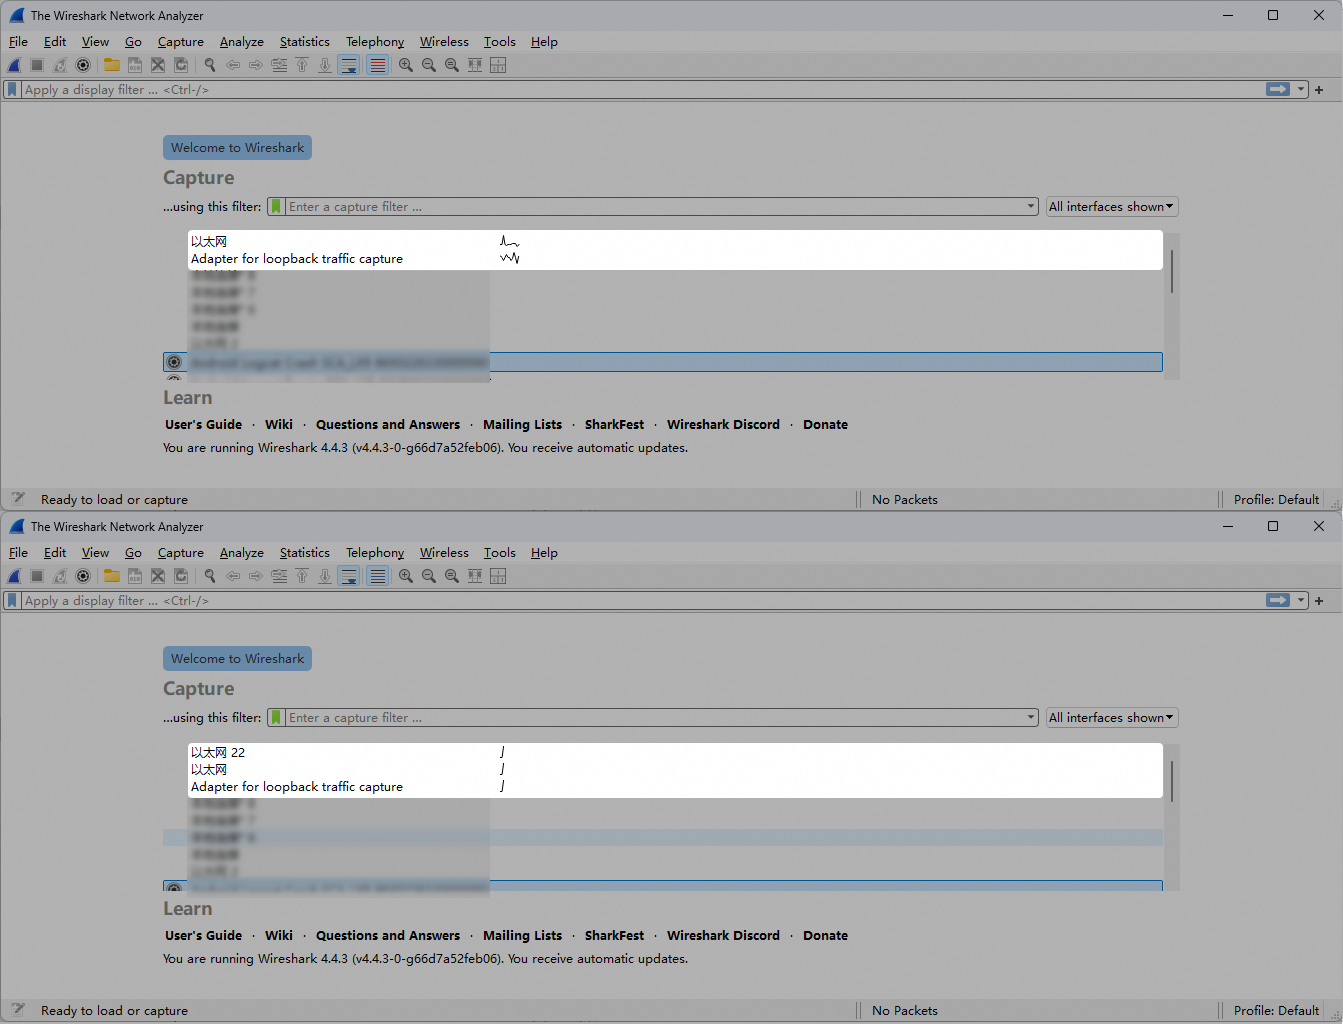

If the newly added Ethernet adapter is not displayed, check the following:
- Whether the USB connection is working properly.
- Whether network packet analysis is enabled on the phone or tablet.
Step 2: Start packet capture
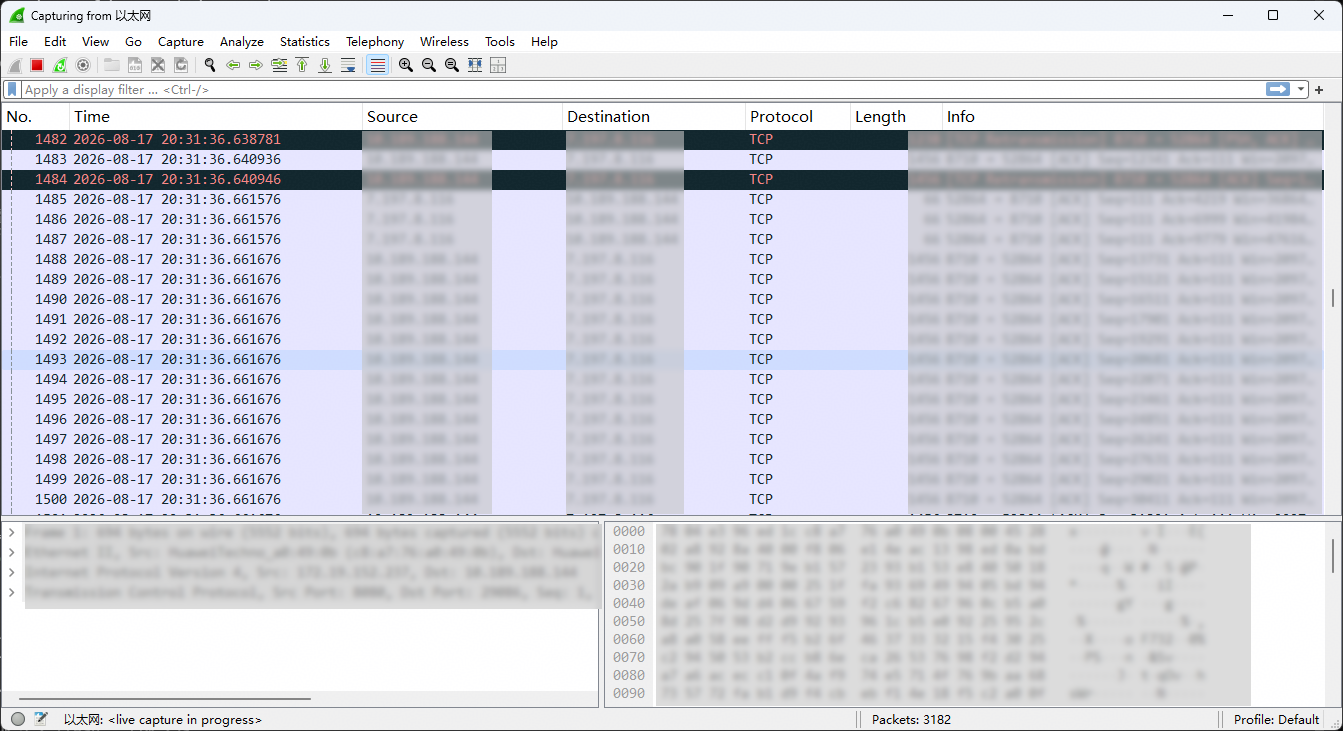
- In the Wireshark network adapter list, double-click the selected Ethernet adapter to start packet capture.
- Captured packets are displayed in the packet capture window.
Step 3: Interpret the captured packets
The packet capture window consists mainly of three areas:
| Area | Description |
|---|---|
| Packet list | Displays an overview of all captured packets. |
| Packet details: | Displays detailed protocol information about the selected packet. |
| Packet bytes | Displays the raw byte data of the selected packet. |
The columns in the packet list are described below:
| Column | Description |
|---|---|
| No. | Packet sequence number. |
| Time | Relative time elapsed since packet capture started. |
| Source | Source address (IP or MAC address). |
| Destination | Destination address (IP or MAC address). |
| Protocol | Protocol type, such as TCP, UDP, or HTTP. |
| Length | Packet length, in bytes. |
| Info | Basic packet information. |
Wireshark uses colors to distinguish different types of packets:
| Color | Description | Example |
|---|---|---|
| Green | Normal TCP traffic | Data transmission |
| Dark blue | TCP control packets | SYN, FIN, ACK |
| Light blue | UDP traffic | DNS queries, QUIC |
| Yellow | Warnings or anomalies | TCP retransmissions, out-of-order packets |
| Red | Errors or anomalies | TCP errors, checksum errors |
| Black | Malformed packets | Corrupted packets |
For more information about network packet analysis in Wireshark, see the Wireshark official website or other publicly available resources.
Step 4: Set filters (optional)
To reduce irrelevant traffic, use filters as needed:
| Filter | Description | Example |
|---|---|---|
| By protocol | Displays only packets of a specific protocol. | tcp, udp, http |
| By IP address | Displays only packets related to a specific IP address. | ip.addr == 192.168.1.100 |
| By port | Displays only packets on a specific port. | tcp.port == 8080 |
| Combined | Combines multiple filter conditions. | tcp and ip.addr == 192.168.1.100 |
Step 5: Stop packet capture and save the results
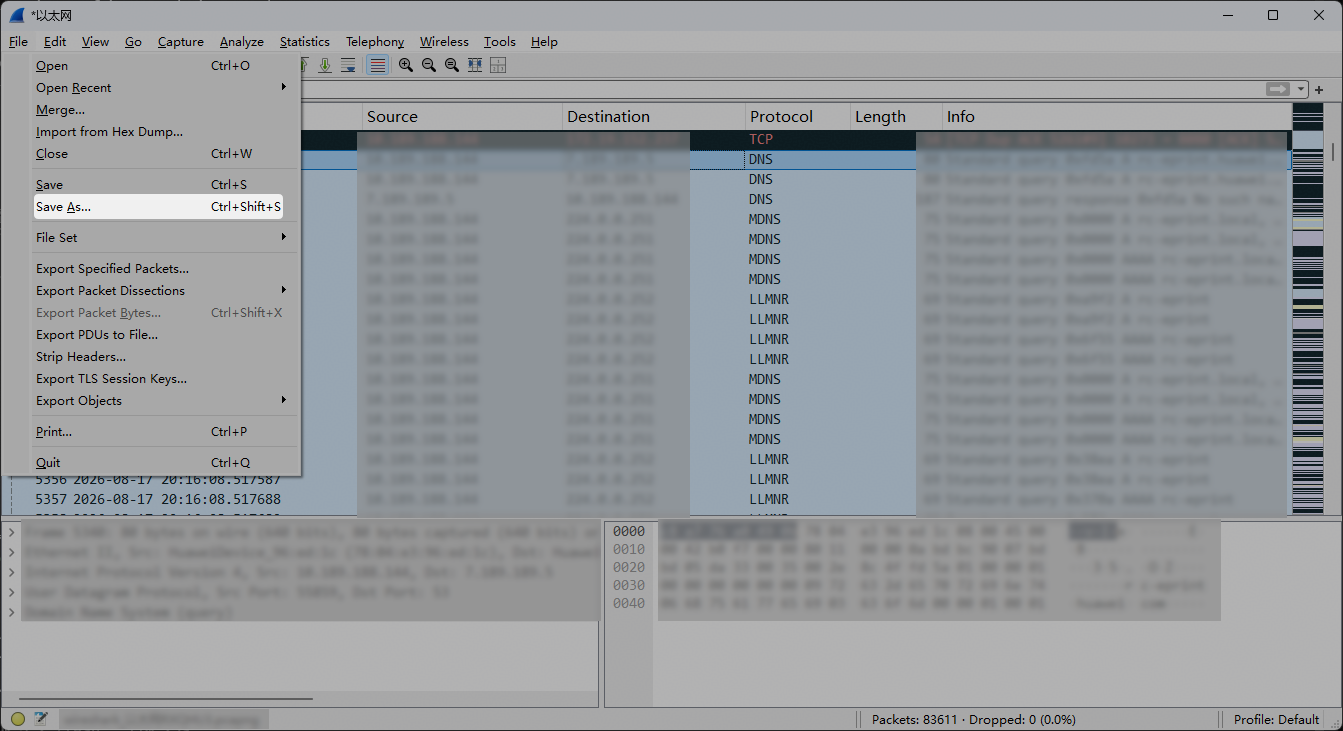
- Click the red stop button on the toolbar to stop packet capture.
- Press Ctrl+Shift+S to save the packet capture file.
- Select a save location and specify a file name.
[h2]Disabling Network Packet Analysis
Method 1: Use the switch
- On the phone or tablet, go to Settings -> System -> Developer options and locate the network packet analysis switch.
- Tap the switch to turn off the feature.

If you enable the feature again after disabling it, close the current packet capture window in Wireshark on the PC, select the newly added Ethernet adapter again, and restart packet capture.
Method 2: Disconnect USB
Disconnect the phone or tablet from USB. Network packet analysis is automatically disabled.
[h2]The Network Packet Analysis Switch Is Grayed Out and Cannot Be Tapped
Symptom
The network packet analysis switch in Developer options is grayed out and cannot be used.
Possible causes
The USB connection is unavailable or unstable.
Solution
- Check the USB connection and ensure that the USB cable supports data transmission.
- Disconnect and reconnect the USB cable.
- If the issue persists, the phone or tablet hardware may not support this feature.
[h2]No New Ethernet Adapter Appears in Wireshark After Network Packet Analysis Is Enabled
Symptom
Network packet analysis is enabled on the Phone or Tablet, but no new Ethernet adapter appears in the Wireshark network adapter list.
Solution
- Disable and then re-enable network packet analysis on the phone or tablet.
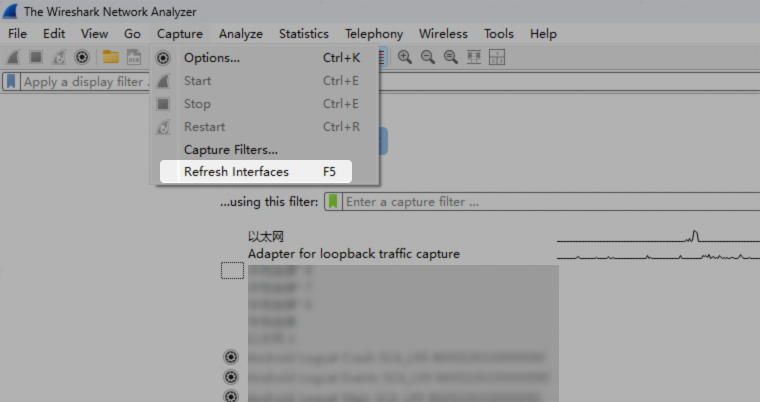
- Restart Wireshark and click the button for refreshing the network adapter list.
[h2]No or Very Few Packets Are Captured
Symptom
Packet capture has started, but no packets or very few packets are captured.
Possible causes
There is no actual network traffic on the phone or tablet.
The Wireshark filter is too restrictive, for example, it limits traffic to a specific IP address or port.
Solution
- Open a web page in a browser or play a video on the Phone or Tablet, and check whether network traffic appears.
- Check whether the Wireshark filter is configured correctly. Try clearing all filters.
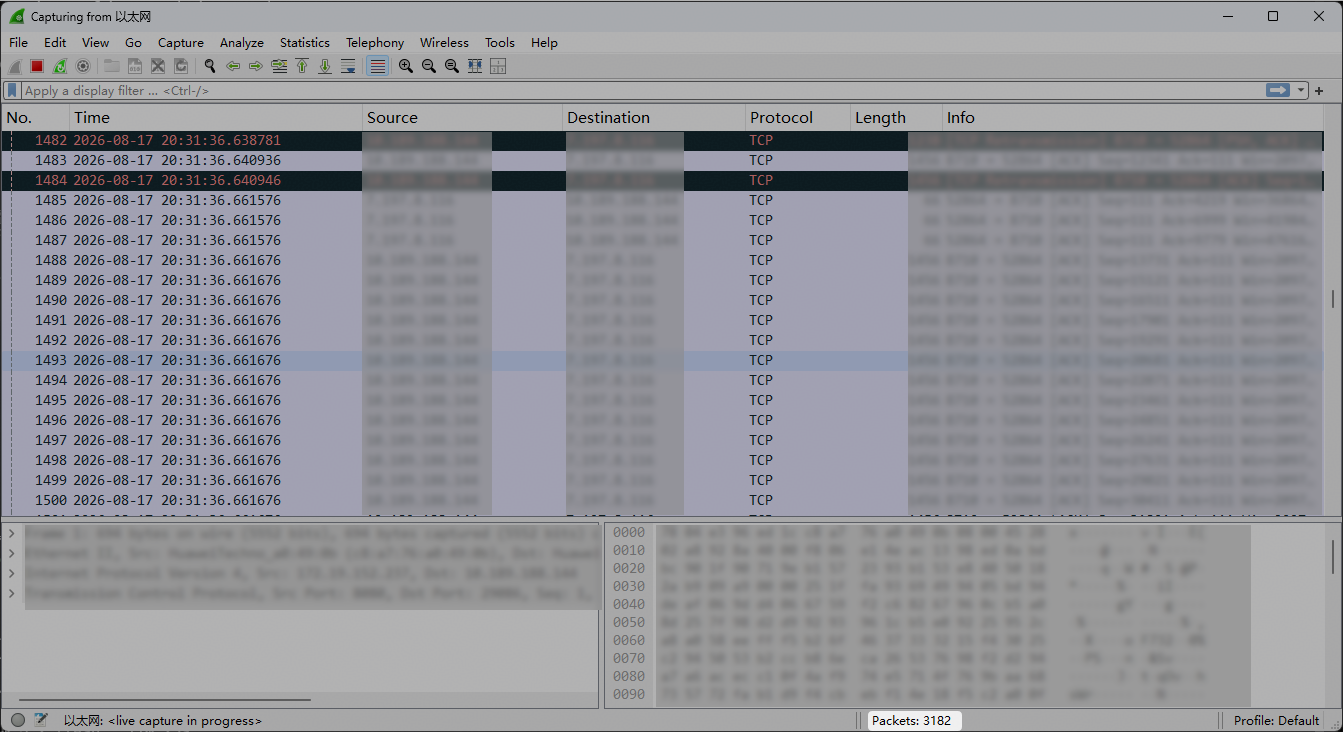
- Check whether the Ethernet adapter is receiving data by viewing the packet statistics in the Wireshark status bar.
[h2]Network Packet Analysis Is Interrupted During Use
Symptom
Network packet capture stops unexpectedly.
Possible causes
USB debugging or USB tethering is enabled during network packet capture.
The USB connection is unstable. If the USB connection is unexpectedly disconnected and then restored, network packet analysis must be manually re-enabled.
Wireshark encounters an error.
Solution
- Do not enable USB debugging or USB tethering during network packet capture.
- Use a USB cable with a reliable connection.
- Restart Wireshark and reselect the Ethernet adapter corresponding to the phone or tablet.
[h2]The Phone or Tablet Heats Up After Network Packet Analysis Is Enabled
Symptom
The device heats up after network packet analysis is enabled.
Solution
It is normal for the phone or tablet to generate more heat while this feature is enabled. Disable network packet analysis promptly after debugging is complete.