Overview
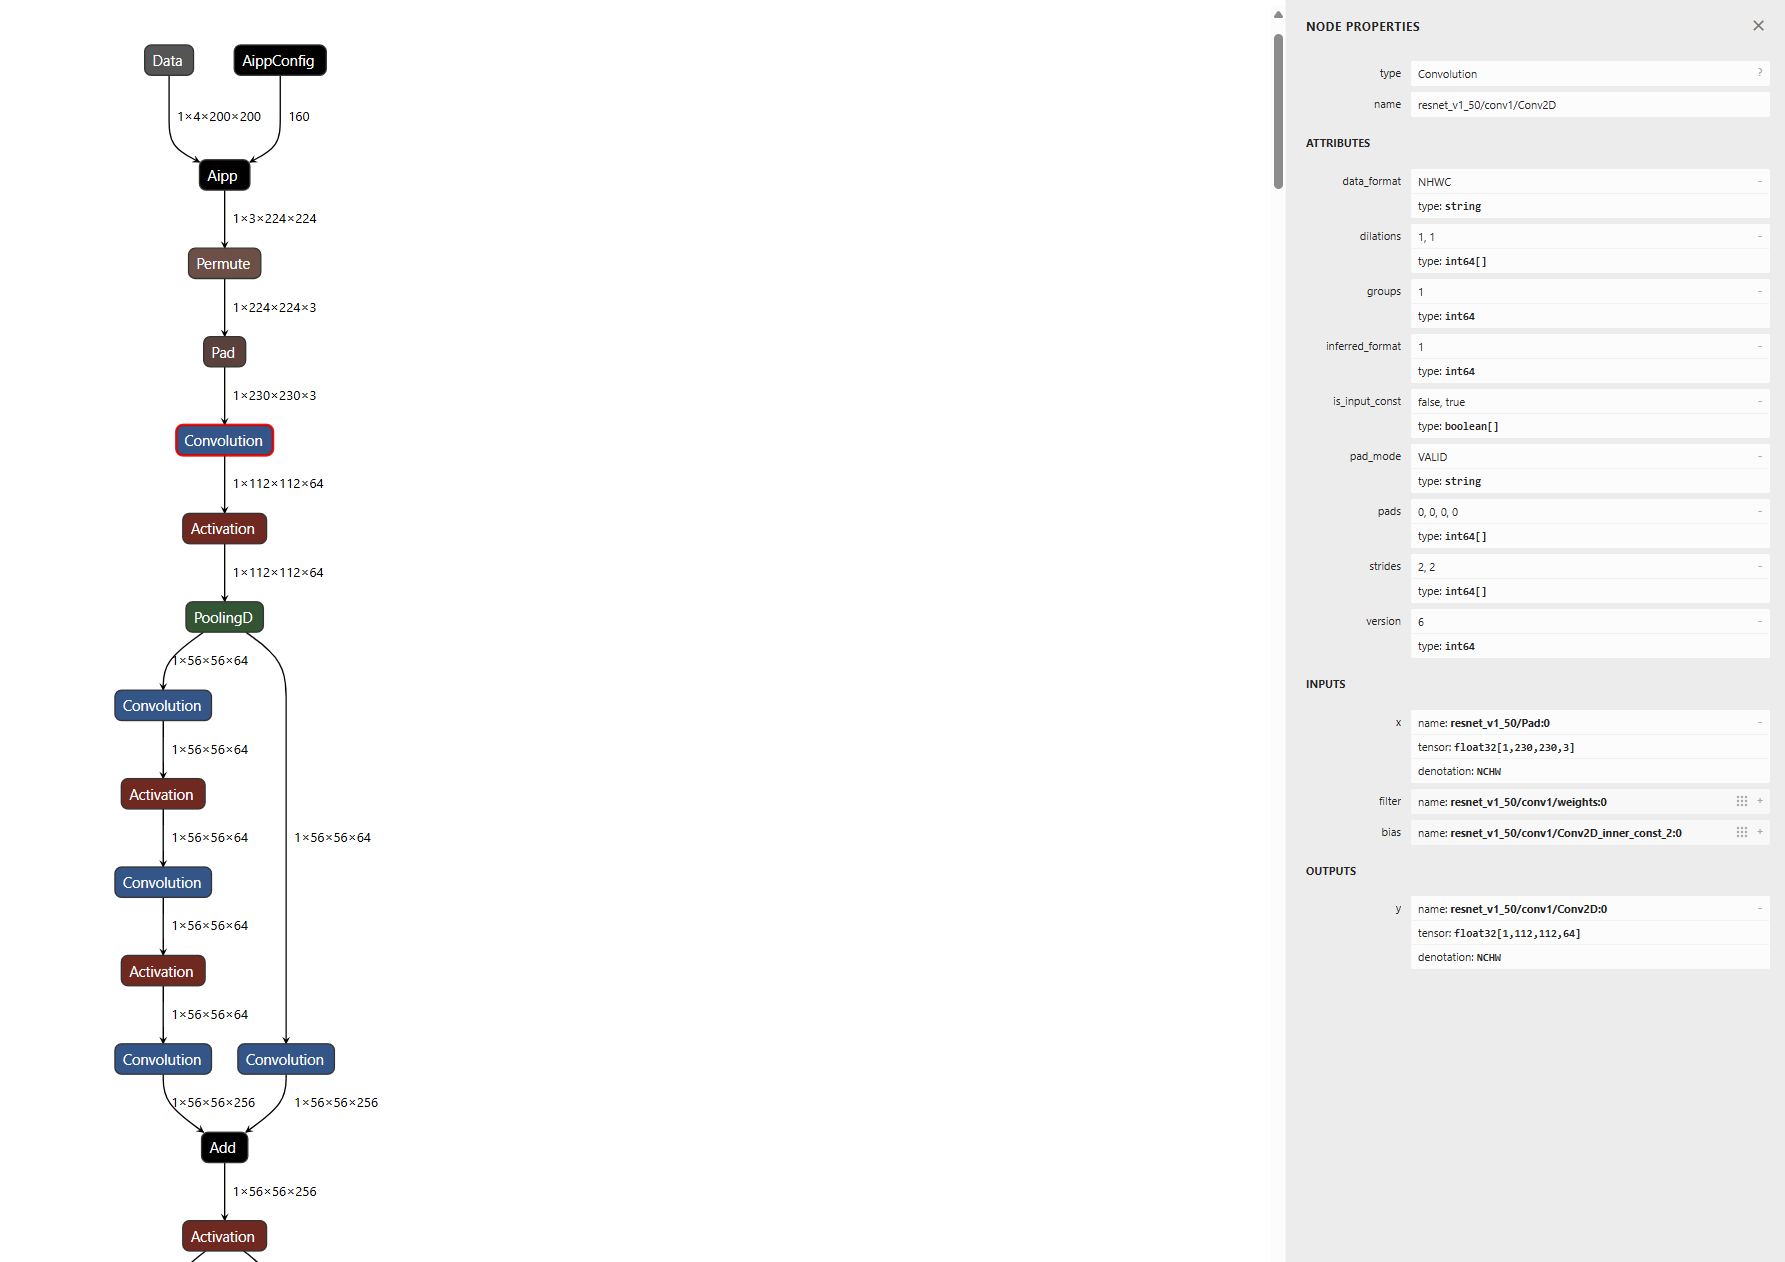
Netron is a neural network model visualization tool that supports the visualization of many mainstream AI framework models. Netron 5.1.6 and later versions support .om model visualization. As shown in the following figure, after an .om model is loaded using Netron, its topology structure, graph, and node information are displayed.
Function Description
Load .om models.
Display the topology structure and data flow shape.
View model parameters such as the format, input, and output.
View the subgraph and operator device information of a compiled model.
View information about nodes such as NODE PROPERTIES, ATTRIBUTES, INPUTS, and OUTPUTS.
Save and export the visualization result as an image.
[h2]Installing the Tool
Download the latest Netron.
Install Netron.
- macOS: Download the .dmg file or run the brew cask install netron command.
- Linux: Download the .AppImage file or run the snap install netron command.
- Windows: Download the .exe file or run the winget install netron command.
- Python server: Run pip install netron to install Netron, and then run the netron [FILE] or netron.start('[FILE]') to load a model.
- Browser: Open the web-based Netron and you can use it without the need to install it.
After the installation is complete, drag the model to the window to open it.
[h2]Viewing Subgraphs
View the subgraphs of a compiled model as follows:
Drag the compiled model to the Netron tool to open it.
Click the subgraph node, go to ATTRIBUTES->subgraph on the right, and click the attribute value of subgraph.
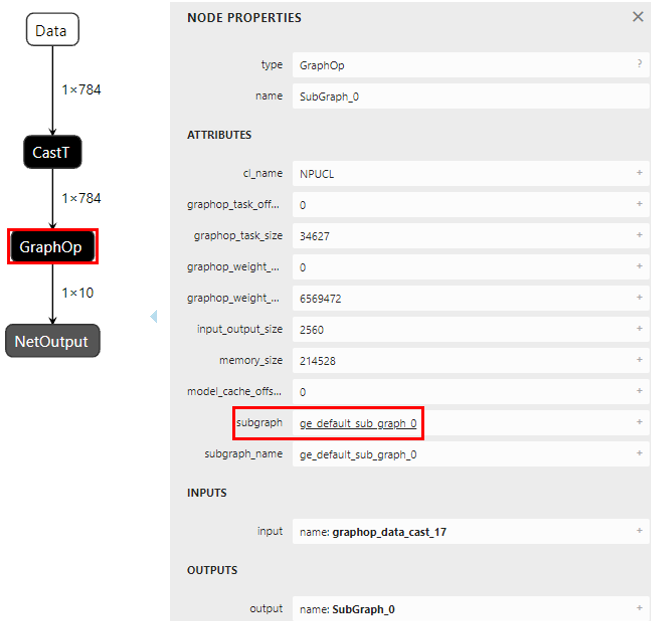
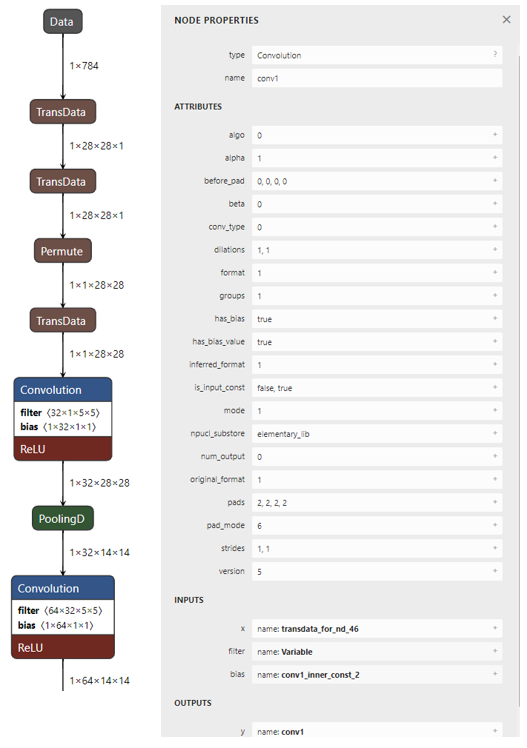
View information about subgraph nodes, such as NODE PROPERTIES, ATTRIBUTES, INPUTS, and OUTPUTS.
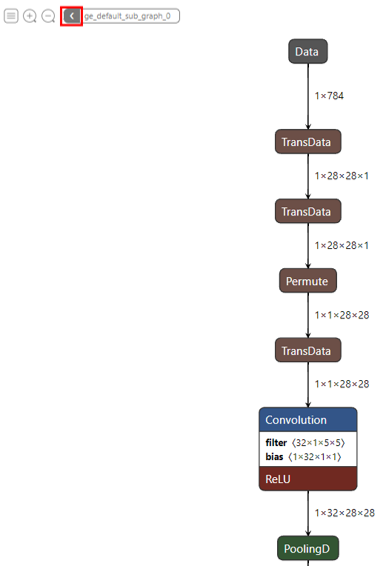
Click the arrow in the upper left corner to return to the main graph.